MNJ01-001
You are sitting in respiratory OPD of your hospital, 8 years old child Rajeev came with his lung function report.
| Predicted | Measured | ||
|---|---|---|---|
| FVC | 2.07 | 1.31 | (63%) of best |
| FEV1 | 1.85 | 1.08 | (51%) of best |
| PEF | 275 | 210 |
- Which type of pulmonary function is this result reflecting?
- What may be the possible causes (write 2)?
- What type of pulmonary function result will you get in a child with cystic fibrosis?
Answer
- Restrictive type
- Kyphoscoliosis, muscular dystrophy
- Mixed type in cystic fibrosis
- Both FVC and FEV1 are markedly reduced in restrictive type of pattern.
- FVC near normal but FEV1 is markedly reduced in obstructive type of pattern (Asthma).
- FVC is low but FEV1 much more markedly reduced in mixed type of pattern (Cystic fibrosis).
MNJ01-002
A 7 years old girl Rajni reviewed in respiratory clinic. Here is her flow volume graph.
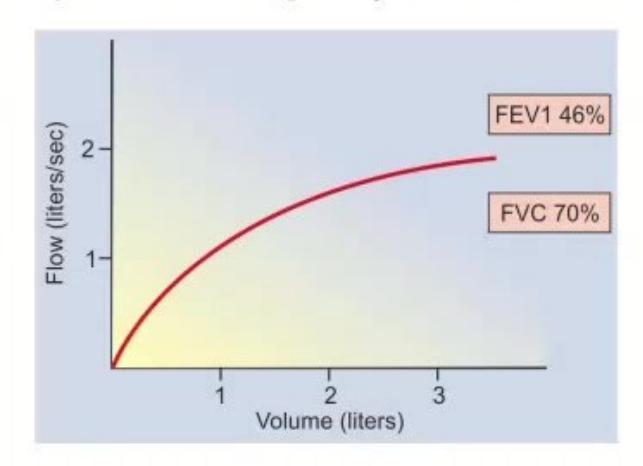

- Which type of pattern is this graph reflecting and what is the most common diagnosis?
- What genetic mutation may she have?
- Which drugs for nebulisation will you prescribe if she had recurrent culture positive pneumonia?
Answer
- Mixed type, cystic fibrosis
- Delta F508 mutation for CFTR gene
- Colistin (or Tobramycin)
MNJ01-003
You are sitting in respiratory OPD of your hospital, 14 years old child Rahul came with his lung function report.
| Predicted | Measured | ||
|---|---|---|---|
| FVC | 4.07 | 3.6 | (84%) of best |
| FEV1 | 3.90 | 2.24 | (56%) of best |
| PEF | 490 | 260 | (54%) of best |
| FEF (25-75%) | 4.07 | 1.68 | (42%) of best |
- Which type of pulmonary function is this result reflecting and what is the most common diagnosis?
- What may be the other possible causes (write 2 other than most common)?
- What lung function parameter measurement is best for this child in future?
Answer
- Obstructive, most common — Asthma
- Pneumonia, bronchiolitis (or foreign body aspiration, bronchiectasis)
- FEF (25-75%) — best for measurement of small airway disease; Peak flow (PEF) is best for large airway disease follow-up.
MNJ01-004
A 2 years old non-cyanotic child came to you with her cardiac catheter result.
| Chamber / Vessel | Saturation (%) | Pressure (mm Hg) |
|---|---|---|
| SVC | 79 | |
| RA | 88 | |
| RV | 86 | |
| PA | 86 | |
| LA | 96 | -/6 |
| LV | 96 | |
| Aorta | 96 |
- Is this catheter report normal? If not, what is the possible diagnosis?
- What is normal saturation in RA and RV?
- What pressure will you expect in RA in this child?
Answer
- Not normal; Atrial Septal Defect (ASD) (step-up in saturation at RA level).
- Normal saturation in RA: ~70-75% (<80%), RV: ~70-75%.
- Mean pressure in RA: ~-/6 mm Hg (normal is ~-/4 mm Hg).
Guide: How to Solve Cardiac Catheter Questions
- Make a schematic heart:
- RA, LA, RV, LV, PA, Aorta
- Mark the saturation in heart areas:
- Left-sided saturations > 90% (Normal: 95-98%)
- Right-sided saturations < 80% (Normal: 70-75%)
- Step-up on right side indicates left-to-right shunt (ASD at RA, VSD at RV, PDA at PA).
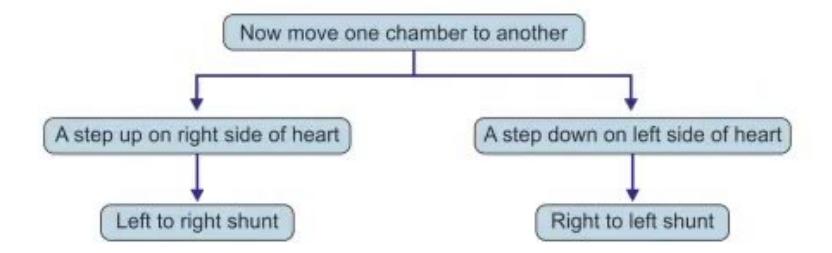
- Mark the pressure in heart chambers:
- All right-sided pressures should be less than left side.
- Equality of systolic pressure indicates mixing / shunt.
- Systolic pressure drop across a valve indicates valve stenosis.
Examples:
1. Saturation:
- Normal: RA 75%, RV 75%, PA 75%, LA 96%, LV 96%, Aorta 96%
- ASD: RA 88%, RV 86%, PA 86%, LA 96%, LV 96%, Aorta 96%
- VSD: RA 75%, RV 88%, PA 88%, LA 96%, LV 96%, Aorta 96%
- TGA: RA 96%, RV 96%, Aorta 96%, LA 80%, LV 80%, PA 80%
2. Pressures (mm Hg):
- Normal: RA -/4, RV 20/4, PA 20/10; LA -/7, LV 100/10, Aorta 100/70
- Pulmonary Stenosis: RV 60/4, PA 20/10
- Coarctation of Aorta: Ascending aorta 150/70, Descending aorta 70/30
MNJ01-005
A 5 years old child came to you with her cardiac catheter result. He was born as a preterm baby.
| Chamber / Vessel | Saturation (%) |
|---|---|
| SVC | 70 |
| RA | 70 |
| RV | 70 |
| PA | 70 |
| LA | 88 |
| LV | 88 |
| Aorta | 88 |
- What is the possible system affected — lung or heart?
- What is the possible diagnosis?
Answer
- Lung
- Bronchopulmonary dysplasia (BPD)
MNJ01-006
A 4 years old child came to you with her cardiac catheter result.
| Chamber / Vessel | Saturation (%) | Pressure (mm Hg) |
|---|---|---|
| RA | 74 | -/4 |
| RV | 74 | 70/30 |
| PA | 74 | 22/12 |
| LA | 96 | -/8 |
| LV | 96 | 100/8 |

- What is the diagnosis from this catheter report?
- Write 2 ECG changes.
Answer
- Pulmonary stenosis (marked systolic pressure gradient between RV 70 mmHg and PA 22 mmHg).
- Right ventricular hypertrophy:
- Upright T wave in V1 (after 3 days to 6 years of age)
- Tall R wave in V1
- Right axis deviation
MNJ01-007
You are asked to see a 7 years old boy who has been suffering from headache. His blood pressure is 160/96 mm Hg. You also noticed a murmur on examination.
| Chamber / Vessel | Saturation (%) | Pressure (mm Hg) |
|---|---|---|
| LA | 96 | -/10 |
| LV | 96 | 150/10 |
| Ascending aorta | 96 | 150/70 |
| Descending aorta | 96 | 70/30 |
- What is the possible diagnosis in this child?
- State the expected pressures and saturations in the affected chambers and vessels.
Answer
- Coarctation of aorta (CoA)
- Pressures and Saturations:
- Left Atrium (LA): Saturation 96%, Pressure -/10 mm Hg
- Left Ventricle (LV): Saturation 96%, Pressure 150/10 mm Hg
- Ascending aorta: Saturation 96%, Pressure 150/70 mm Hg
- Descending aorta: Saturation 96%, Pressure 70/30 mm Hg
- Coarctation of aorta is an acyanotic lesion, so there is no drop in oxygen saturation across the defect. The hallmark is the systolic pressure gradient between the ascending aorta (upper limb hypertension) and descending aorta (lower limb hypotension).
MNJ01-008
Test hearing in a 13 years old boy, describing at each step the procedure. (You are provided with tuning forks of frequencies 128 Hz, 256 Hz, 512 Hz.)
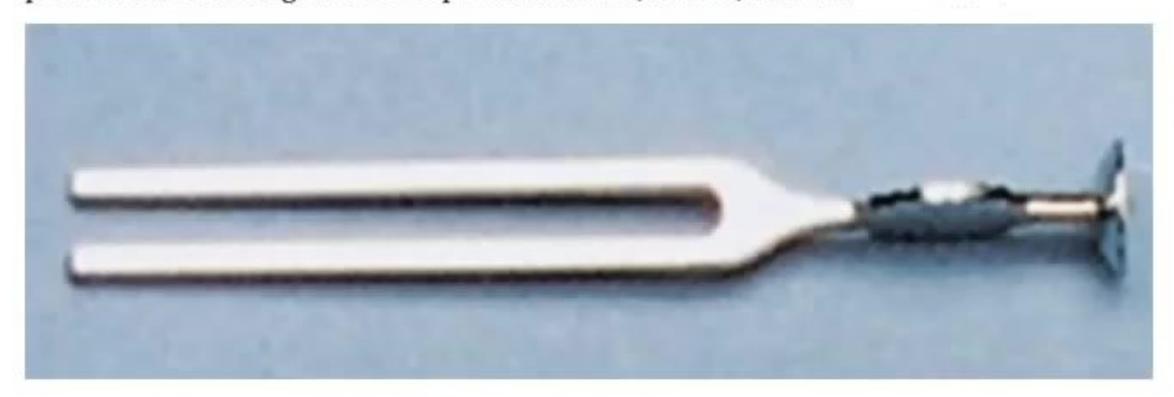
- Describe the steps of the tuning fork examination (Rinne and Weber tests).
Answer
- Greet the patient, introduce yourself, and establish rapport.
- Obtain permission/consent from parent/child and explain the procedure.
- Select the appropriate tuning fork (512 Hz or 256 Hz; 128 Hz is used for vibration sense, not hearing).
- Rinne test:
- Strike the tuning fork lightly on the elbow or thenar eminence.
- Hold it ~2 cm from the external auditory meatus (air conduction) and place the base firmly on the mastoid process (bone conduction).
- Ask the patient which sound is louder/longer.
- Normal (Rinne positive): Air conduction > Bone conduction.
- Conductive hearing loss (Rinne negative): Bone conduction > Air conduction.
- Sensorineural hearing loss: Air conduction > Bone conduction (both reduced).
- Weber test:
- Place the base of the vibrating tuning fork on the vertex or midline forehead.
- Ask if sound is heard in the midline or lateralized to one ear.
- Normal: Heard equally in midline.
- Sensorineural loss: Lateralizes to the normal (unaffected) ear.
- Conductive loss: Lateralizes to the abnormal (affected) ear.
- Thank the patient and parent.
MNJ01-009
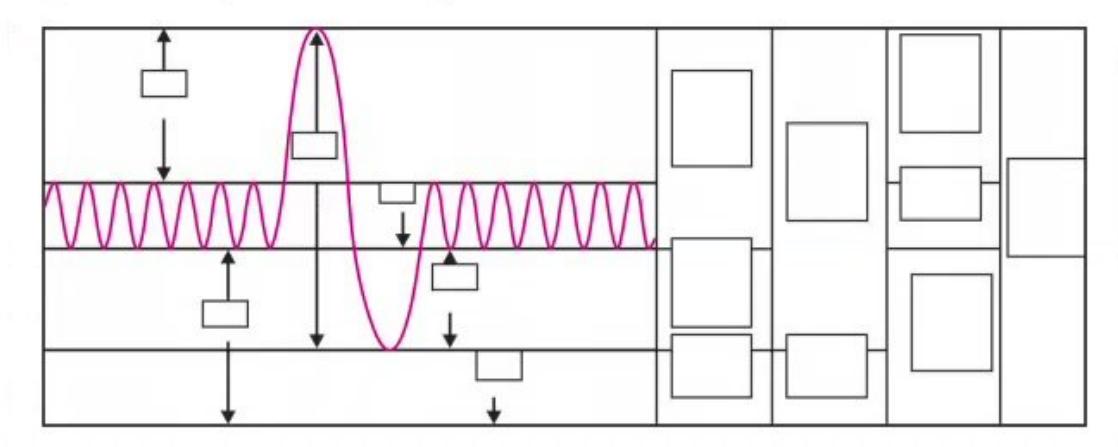
Mark the lung volumes and capacities on the spirogram below.
Answer
![[images/MNJ-P-OSCE 01. Data Interpretation_page_8_Figure_6.jpeg]]
- Lung Volumes:
- Tidal Volume (TV)
- Inspiratory Reserve Volume (IRV)
- Expiratory Reserve Volume (ERV)
- Residual Volume (RV)
- Lung Capacities:
- Inspiratory Capacity (IC = TV + IRV)
- Functional Residual Capacity (FRC = ERV + RV)
- Vital Capacity (VC = IRV + TV + ERV)
- Total Lung Capacity (TLC = VC + RV)
Rule of thumb: A single component is a volume; a combination of two or more volumes is a capacity.
MNJ01-010
Theme: Interpretation of amino acids
- A. Phenylketonuria
- B. Tyrosinaemia
- C. Non-ketotic hyperglycinaemia
- D. Ornithine transcarbamylase deficiency (OTC deficiency)
- E. Maple syrup urine disease (MSUD)
For each of the following amino acid results, select from the list above the most likely diagnosis.
Patient 1:
| Amino acid | Value (μmol/L) | Normal range (μmol/L) |
|---|---|---|
| Serine | 129 | 51-230 |
| Glutamine | 453 | 300-760 |
| Glycine | 222 | 80-300 |
| Leucine | 1137 | 55-160 |
| Isoleucine | 457 | 25-150 |
| Valine | 826 | 90-550 |
| Arginine | 104 | 20-180 |
| Phenylalanine | 76 | 30-100 |
| Tyrosine | 60 | 20-150 |
Patient 2:
| Amino acid | Value (μmol/L) | Normal range (μmol/L) |
|---|---|---|
| Serine | 124 | 51-230 |
| Glutamine | 4122 | 300-760 |
| Glycine | 301 | 80-300 |
| Leucine | 230 | 55-160 |
| Isoleucine | 75 | 25-150 |
| Valine | 300 | 90-550 |
| Arginine | 70 | 20-180 |
| Phenylalanine | 50 | 30-100 |
| Tyrosine | 280 | 20-150 |
Patient 3:
| Amino acid | Value (μmol/L) | Normal range (μmol/L) |
|---|---|---|
| Serine | 190 | 51-230 |
| Glutamine | 340 | 300-760 |
| Glycine | 310 | 80-300 |
| Leucine | 120 | 55-160 |
| Isoleucine | 65 | 25-150 |
| Valine | 200 | 90-550 |
| Arginine | 30 | 20-180 |
| Phenylalanine | 1500 | 30-100 |
| Tyrosine | 50 | 20-150 |
Answer
- Patient 1: E. Maple syrup urine disease (MSUD)
- The branched-chain amino acids (leucine, isoleucine, and valine) share a common enzyme (branched-chain alpha-keto acid dehydrogenase) in their catabolic pathway. Deficiency results in marked elevation of all three amino acids.
- Patient 2: D. Ornithine transcarbamylase deficiency (OTC deficiency)
- This amino acid profile suggests a defect of the urea cycle. Excess ammonia is 'mopped up' by glutamate with a resultant massive increase in glutamine (4122 μmol/L).
- Patient 3: A. Phenylketonuria (PKU)
- Phenylalanine hydroxylase converts phenylalanine to tyrosine. Deficiency leads to markedly elevated phenylalanine (>1000 μmol/L, here 1500 μmol/L) and low/normal tyrosine.
MNJ01-011
A 6 years old girl Ritu was found to have a poor cortisol response when hypoglycaemic. On the basis of the results of further investigations shown below:
| Synacthen test | |||
|---|---|---|---|
| Time (min) | 0 | 30 | 60 |
| Cortisol (nmol/L) | 101 | 94 | 89 |
| Very-long-chain fatty acids | Value | Normal range |
|---|---|---|
| C24 / C22 ratio | 1.54 | < 0.96 |
| C26 / C22 ratio | 0.056 | < 0.022 |

- What is the possible diagnosis — Addison disease or adrenoleukodystrophy?
- What are these test results showing?
- What is the genetic inheritance of this disease?
Answer
- Adrenoleukodystrophy (X-ALD)
- The short Synacthen test shows primary adrenal insufficiency (flat cortisol response with no rise after ACTH stimulation). The very long chain fatty acids (VLCFAs) are significantly elevated (elevated C24/C22 and C26/C22 ratios), confirming adrenoleukodystrophy.
- X-linked recessive (ABCD1 gene mutation)
MNJ01-012
Theme: Hepatitis B
| Profile | ALT | HBV DNA | cAb | HBsAg | Anti-HBs | HBeAg | Anti-HBe |
|---|---|---|---|---|---|---|---|
| A | ↑ | Detectable | IgM | + | - | + | - |
| B | ↑ | Detectable | IgM | + | - | - | + |
| C | ↑ | Detectable | IgG | + | - | + | - |
| D | Normal | High | IgG | + | - | + | - |
| E | Normal | Undetectable | IgG | - | + | - | + |
| F | Normal | Undetectable | IgG | + | - | - | + |
cAb = core antibody, eAb = envelope antibody, eAg = envelope antigen, HBV = hepatitis B virus
For each of the serologies above, select the correct diagnosis from the following:
- Chronic hepatitis B infection, non-replicative phase
- Acute hepatitis B infection with pre-core mutant
- Chronic hepatitis B infection, immune clearance phase
- Immune tolerant
Answer
- Chronic hepatitis B infection, non-replicative phase: F
- Acute hepatitis B infection with pre-core mutant: B
- Chronic hepatitis B infection, immune clearance phase: C
- Immune tolerant: D
Hepatitis B Serology Phases Guide:
| Host HBV status | ALT | HBV DNA | Anti-HBc (cAb) | HBsAg | Anti-HBs | HBeAg* | Anti-HBe |
|---|---|---|---|---|---|---|---|
| Acute hepatitis B | ↑ | Detectable | IgM | + | - | + | - |
| Pre-core mutant (acute) | ↑ | Detectable | IgM | + | - | - | + |
| Immune tolerance | Normal | High | IgG | + | - | + | - |
| Immune clearance (active chronic) | ↑ | Detectable | IgG | + | - | + | - |
| Non-replicative (inactive carrier) | Normal | Undetectable | IgG | + | - | - | + |
| Resolved infection | Normal | Undetectable | IgG | - | + | - | + |
*HBeAg is absent in pre-core mutants due to a mutation preventing HBeAg synthesis.
Clues for Interpretation:
- HBcAb IgM (+): Acute infection
- HBcAb IgG (+) with HBsAg (+): Chronic infection
- HBeAg (+): High viral replication and infectivity; absent in non-replicative and resolved states (and pre-core mutants).
- Abnormal ALT: Indicates ongoing active liver inflammation / immune clearance.
MNJ01-013
Theme: Blood and coagulation values
| Profile | Hb (g/dL) | Platelets (×10⁵/μL) | Total WCC (/mm³) | Neutrophils (%) | INR |
|---|---|---|---|---|---|
| A | 10.5 | 0.44 | 10,000 | 60 | 1.1 |
| B | 12.2 | 3.2 | 6,000 | 38 | 1.1 |
| C | 6.2 | 0.4 | 15,000 | 70 | 1.15 |
| D | 8.0 | 0.2 | 2,200 | 20 | 1.15 |
| E | 18.5 | 1.5 | 18,000 | 65 | 1.3 |
| F | 10.1 | 1.3 | 5,500 | 45 | 0.9 |
| G | 10.6 | 0.3 | 14,000 | 65 | 2.5 |
For each patient below, select the appropriate haematological parameters listed above:
- A 2 years old girl with haemolytic uraemic syndrome (HUS)
- A 3 years old boy with Wiskott-Aldrich syndrome
- A normal 1 day old newborn baby
Answer
- A 2 years old girl with haemolytic uraemic syndrome: C (Microangiopathic hemolytic anemia with low Hb 6.2 g/dL, thrombocytopenia with platelets 40,000/μL, and normal coagulopathy/INR 1.15).
- A 3 years old boy with Wiskott-Aldrich syndrome: A (Microthrombocytopenia with platelets 44,000/μL, mild anemia Hb 10.5 g/dL, normal WCC).
- A normal 1 day old newborn baby: E (Physiological polycythemia with Hb 18.5 g/dL, leukocytosis with WCC 18,000/mm³, and mildly prolonged neonatal INR 1.3).
MNJ01-014
A 3 years old child presents with UTI. On urine culture report you found multiple sensitive antibiotics against E. coli. Compare the MIC (minimum inhibitory concentration) report of the two chosen antibiotics below and select the best one:
In vitro efficacy of amoxicillin (predicts ampicillin):
| Sensitive (MIC) | Intermediate | Resistant |
|---|---|---|
| ≤ 8 | 16 | ≥ 32 |
Tested concentration of amoxicillin: 2 μg/mL
In vitro efficacy of cefovecin:
| Sensitive (MIC) | Intermediate | Resistant |
|---|---|---|
| ≤ 2 | 4 | ≥ 8 |
Tested concentration of cefovecin: 2 μg/mL
- What is MIC?
- Which antibiotic will you choose between these two and why?
- What is the Eagle effect while using antibiotics?
Answer
- Minimum Inhibitory Concentration (MIC): The lowest concentration of an antimicrobial agent that completely prevents visible in vitro growth of a microorganism (expressed in mg/L or μg/mL).
- Choice: Amoxicillin.
- The tested MIC of amoxicillin is 2 μg/mL, which is 4 dilutions below the resistance breakpoint (32 μg/mL) and well within the sensitive range (≤ 8 μg/mL).
- In contrast, the tested MIC of cefovecin is 2 μg/mL, which is only 2 dilutions below resistance (8 μg/mL) and right at the upper limit of the sensitive breakpoint (≤ 2 μg/mL). Amoxicillin therefore provides a wider margin of safety.
- Eagle effect (paradoxical zone phenomenon): A paradoxical decrease in antibacterial killing activity at antibiotic concentrations significantly above the MIC or MBC (minimum bactericidal concentration). High doses can be less bactericidal than optimal therapeutic doses.