THG37-001
Match the features related to various study designs:
| Feature | Study Design |
|---|---|
| i. Exposure status known in the beginning and look for outcome | 1. Cross-sectional study |
| ii. Intervention is under the control of investigator | 2. Case-control study |
| iii. Look for exposure and outcome simultaneously | 3. Observational study |
| iv. Outcome known in the beginning and look for exposure status | 4. Cohort study |
| v. No deliberate intervention | 5. Experiment / RCT |
Answer
- i: 4 (Cohort study)
- ii: 5 (Experiment / RCT)
- iii: 1 (Cross-sectional study)
- iv: 2 (Case-control study)
- v: 3 (Observational study)
THG37-002
Mention the best study design to answer each of the problems:
| Research Problem | Preferred Study Design |
|---|---|
| i. Prevalence of vitamin A deficiency | |
| ii. Clinical course of Zika virus infection | |
| iii. Efficacy of ranitidine against omeprazole in acid peptic disease | |
| iv. Usefulness of procalcitonin in the diagnosis of neonatal sepsis | |
| v. Spectrum of clinical features of a rare genetic disorder |
Answer
- i. Cross-sectional survey
- ii. Prospective cohort study
- iii. Double-blind Randomized Controlled Trial (RCT)
- iv. Diagnostic accuracy / descriptive evaluation study (Cross-sectional diagnostic study)
- v. Case series (or descriptive study)
THG37-003
Fill in the blanks related to classification of the study design, as applicable:
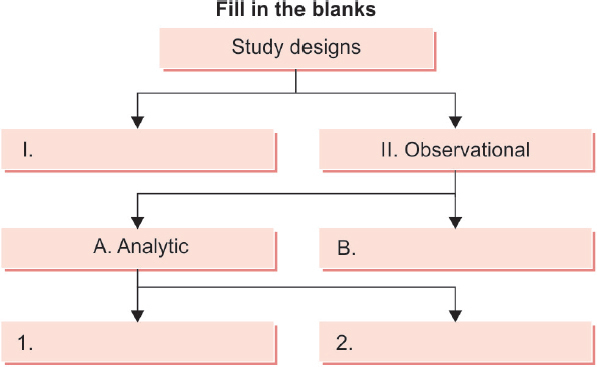
Answer
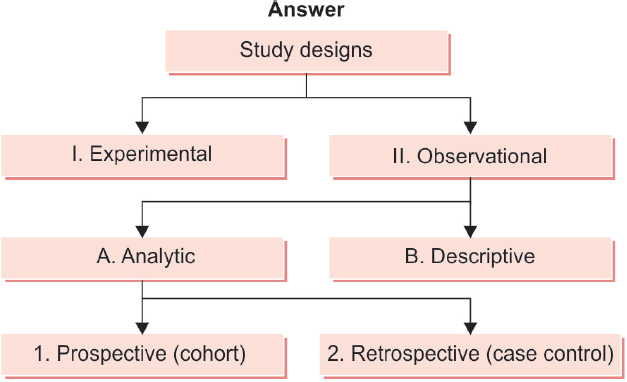
- Study Designs:
- 1. Experimental Studies: Randomized Controlled Trials (RCTs), Non-randomized clinical trials.
- 2. Observational Studies:
- A. Analytic Studies:
- Prospective (Cohort) studies
- Retrospective (Case-control) studies
- B. Descriptive Studies: Cross-sectional surveys, Case series, Case reports.
- A. Analytic Studies:
THG37-004
In a study to assess the vitamin A deficiency in a school, the calculated sample size of 250 children to be collected from the total of 1,000 school children. They were numbered 1 through 1,000. To select the first child, entire 1,000 children were divided (1,000/250) and arrived 4. From the first 4 children, the number 3 child was selected at random as the first in the sample. Then the subsequent children selected were number 7 (3 + 4), number 11 (7 + 4), and so on to complete the required 250 children for the study.
a. What is the procedure we are describing here?
b. What is this method called?
c. What does the number “4” represent?
d. What is the major advantage of this method?
e. What is the major disadvantage of this method?
Answer
- a. Probability sampling technique
- b. Systematic Random Sampling (SyRS)
- c. Sampling interval (
) - d. Easy, fast, and convenient to implement once the sampling frame and interval are established.
- e. Periodic or cyclic patterns in the sampling frame can introduce substantial bias; fails to give proportional representation if hidden periodicity exists.
THG37-005
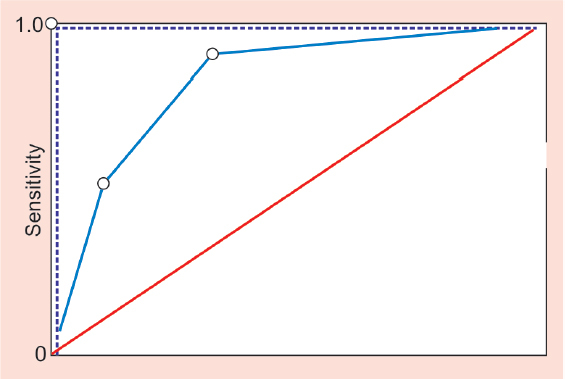
a. What does above image show?
b. What is the purpose of this?
c. What does the X-axis represent?
d. What do the dots along the curve represent?
e. How is interpretation done?
Answer
- a. Receiver Operating Characteristic (ROC) curve
- b. Evaluates diagnostic test accuracy across continuous thresholds, identifies the optimal cut-off value, and compares diagnostic performance between different diagnostic tests.
- c.
(False Positive Rate) - d. Different cut-off points of the diagnostic test plotting their respective Sensitivity vs. (
). - e. The point closest to the upper left corner represents the optimal cut-off (maximizing Youden index:
). The Area Under the Curve (AUC) quantifies overall accuracy: : No discrimination (diagonal reference line) : Good accuracy : Excellent accuracy
THG37-006
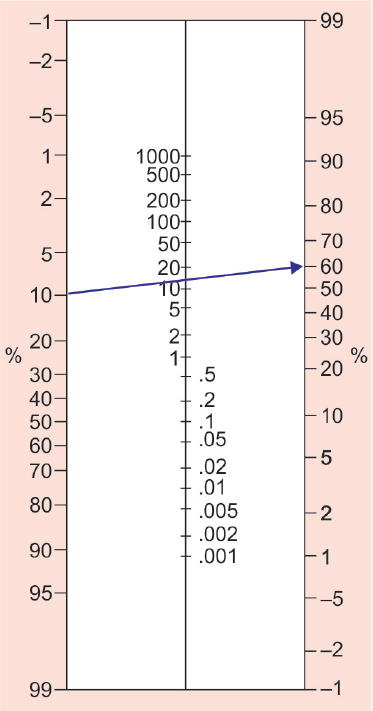
a. What does above image show?
b. What is the purpose of it?
c. What are the three vertical columns of the readings?
d. How is the interpretation done?
e. What is the rough outcome indicated by the arrow in above image?
Answer
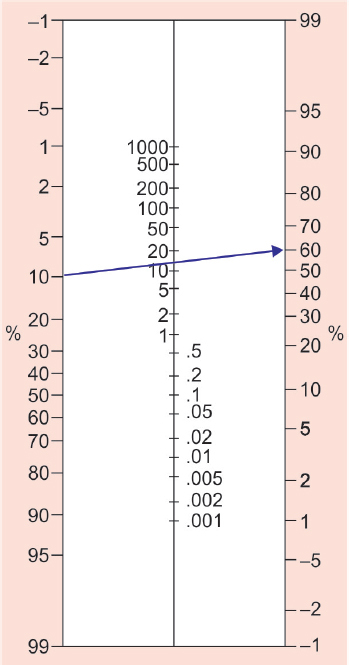
- a. Fagan's Nomogram
- b. Provides a rapid graphical method to calculate post-test probability from pre-test probability and likelihood ratio (LR).
- c.
- Left column: Pre-test probability (%)
- Middle column: Likelihood ratio (LR)
- Right column: Post-test probability (%)
- d. A straight line connecting the known pre-test probability through the test's Likelihood Ratio is extended to intersect the right axis, giving the post-test probability.
- e. Post-test probability of approximately 59%.
THG37-007
Two clinicians examined the fundus for retinopathy in 100 children. Both clinicians concurred for retinopathy in 46 children and no retinopathy in 32 children. For 10 children, clinician I opined retinopathy and clinician II was not for retinopathy. For 12 children, clinician II was for retinopathy and clinician I was not for retinopathy.
a. What are we dealing with?
b. What is the crude agreement?
c. What is the chance agreement expected?
d. What is the actual agreement beyond chance?
e. What is the potential agreement beyond chance?
f. What is the final parameter you arrive?
Answer
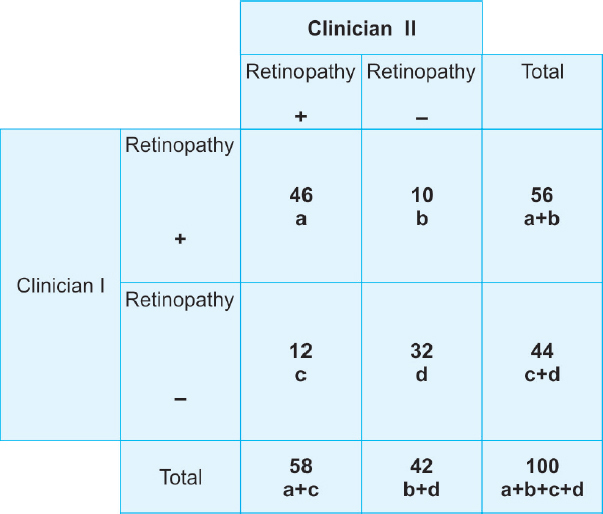

- a. Inter-rater agreement / Cohen's Kappa (
) coefficient - b. Crude / Observed Agreement (
):
- c. Expected Chance Agreement (
): - Clinician I positive:
; Clinician II positive: - Clinician I negative:
; Clinician II negative: - Total
- Clinician I positive:
- d. Actual agreement beyond chance:
- e. Potential agreement beyond chance:
- f. Kappa coefficient (
):
THG37-008
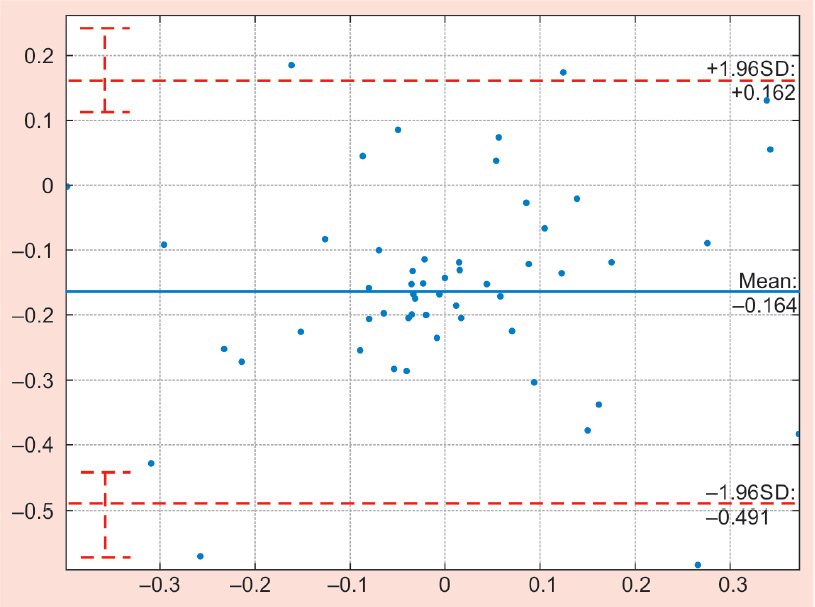
a. What does above image show?
b. What is the purpose of it?
c. What is shown in the “X”-axis?
d. What is shown in the “Y”-axis?
e. What do the solid and dotted lines represent?
Answer
- a. Bland–Altman Plot (Difference plot)
- b. Assesses the agreement between two clinical measurement methods / instruments to determine if they can be used interchangeably.
- c. X-axis: Mean of the two measurements:
- d. Y-axis: Difference between the two measurements:
- e.
- Solid horizontal line: Mean difference (systematic bias).
- Dotted horizontal lines: 95% Limits of Agreement (
).
THG37-009
Fill in with appropriate tools used to critically appraise various types of studies published in a journal:
| Nature of studies | Tools used |
|---|---|
| Systematic reviews and meta-analysis | |
| Meta-analysis of non-RCTs | |
| Randomized controlled trials (RCTs) | |
| Observational studies | |
| Studies on diagnostic test evaluation |
Answer
- Systematic reviews and meta-analysis: PRISMA (Preferred Reporting Items for Systematic Reviews and Meta-Analyses), QUORUM, AMSTAR-2, CASP checklist
- Meta-analysis of non-RCTs: MOOSE (Meta-analysis Of Observational Studies in Epidemiology)
- Randomized controlled trials (RCTs): CONSORT (Consolidated Standards of Reporting Trials), Cochrane Risk of Bias tool (RoB 2)
- Observational studies: STROBE (Strengthening the Reporting of Observational Studies in Epidemiology)
- Studies on diagnostic test evaluation: STARD (Standards for Reporting of Diagnostic Accuracy Studies), QUADAS-2
THG37-010
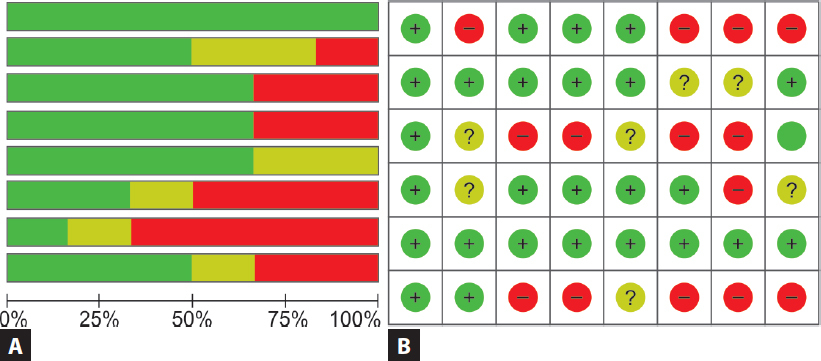
a. What do the images A and B show?
b. What is the purpose of this?
c. What do the colors green, yellow, and red represent?
d. What do the signs “+”, “?”, and “-” in image B represent?
e. What are the aspects considered for assessing?
Answer
- a.
- Image A: Cochrane Risk of Bias Graph (overall percentages across domains).
- Image B: Cochrane Risk of Bias Summary (study-level judgments).
- b. Evaluates internal validity and potential biases in randomized controlled trials included in systematic reviews.
- c.
- Green: Low risk of bias
- Yellow: Unclear risk of bias / Some concerns
- Red: High risk of bias
- d.
- "+": Low risk of bias
- "?": Unclear risk / insufficient information
- "-": High risk of bias
- e. Domains evaluated: Random sequence generation, allocation concealment, blinding of participants and personnel, blinding of outcome assessment, incomplete outcome data, selective reporting, and other sources of bias.
THG37-011
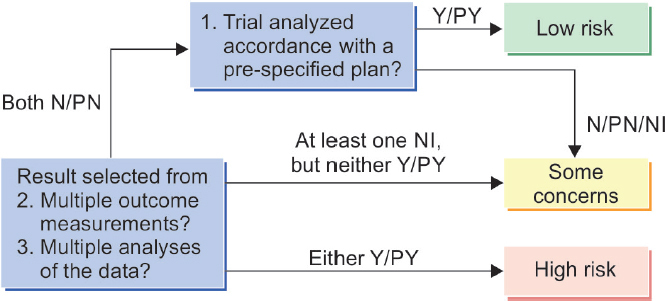
a. What does above image deal with?
b. Where is this used?
c. What do the Y/PY, N/PY, and NI represent?
d. What do the questions 1, 2, and 3 represent?
e. What do the “low risk”, “some concerns”, and “high risk” represent?
Answer
- a. Decision algorithm for assessing Risk of Bias in selection of the reported results (Domain 5 of RoB 2).
- b. Used during quality appraisal of clinical trials in systematic reviews.
- c.
- Y / PY: Yes / Probably Yes
- N / PN: No / Probably No
- NI: No Information
- d. Standardized signaling questions for selective outcome reporting.
- e. Overall risk of bias classification for that domain.
THG37-012
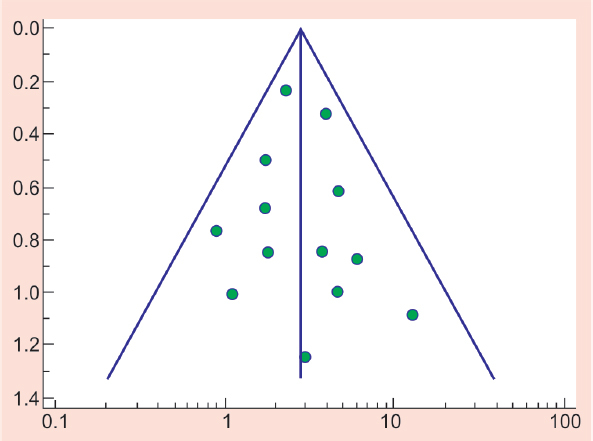
a. What does below image show?
b. What do the symmetric and asymmetric plots indicate?
c. What do the dots represent?
d. What does the empty left lower corner indicate?
e. What does the empty right lower corner indicate?
Answer
- a. Funnel Plot
- b.
- Symmetric plot: Absence of publication bias (studies evenly distributed around the pooled effect estimate).
- Asymmetric plot: Presence of publication bias or small-study effects.
- c. Individual studies included in the meta-analysis (X-axis: Effect size; Y-axis: Study precision / standard error / sample size).
- d. Missing small studies with negative, null, or unfavorable results that were not published.
- e. Missing small studies with larger positive effect size.
THG37-013
Table showing types of variables—fill in the blanks as applicable:
| Variable Classification | Subtypes | Examples |
|---|---|---|
| Quantitative (Metric) | Continuous | Height, Weight, Blood Pressure |
| Discrete | Number of children, Asthma attacks per week | |
| Qualitative (Categorical) | Dichotomous / Binary | Yes/No, Present/Absent |
| Ordinal (Ordered) | Cancer staging (I–IV), Pain scale (Mild/Mod/Severe) | |
| Nominal (Unordered) | Blood groups (A, B, AB, O), Gender, Nationality |
Answer
- Continuous quantitative: Blood pressure, height, weight, age
- Discrete quantitative: Number of children, number of asthma exacerbations per week
- Binary/Dichotomous: Yes/No, Dead/Alive, Present/Absent
- Ordinal categorical: Cancer grades (I–IV), Likert scale (Agree/Neutral/Disagree)
- Nominal categorical: Blood groups (A, B, AB, O), Eye color, Marital status
THG37-014
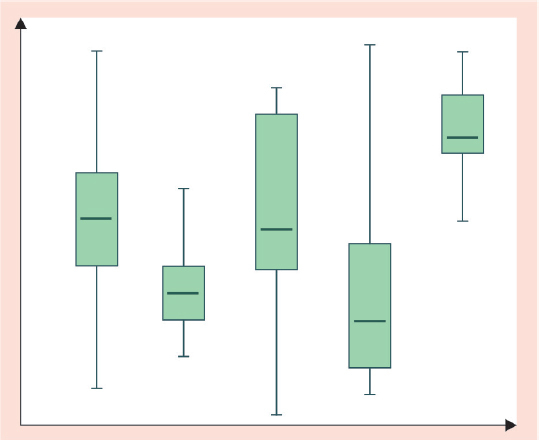
a. What does above image show?
b. For what type of data it is used?
c. What visual impression it captures?
d. What does the line in the box represent?
e. What do the lines at the ends of box represent?
Answer
- a. Box-and-Whisker Plot
- b. Non-parametric / non-Gaussian (skewed) continuous data.
- c. Captures central tendency (median), dispersion (interquartile range), skewness, and outliers.
- d. Median (50th percentile)
- e. Box ends represent the 25th percentile (
) and 75th percentile ( ) (Interquartile Range, ). The outer whiskers represent minimum and maximum non-outlier values ( ).
THG37-015
In a study to find out the risk of hypertension among those consume high salt, total study subjects recruited were 966. Among them, 414 had the habit of consuming high salt, out of whom 34 were hypertensives. There were 904 normotensives. Among those taking normal salt intake, 28 had hypertension.
What is the:
a. Attributable risk (AR)?
b. Attributable risk fraction (AR%)?
c. Population attributable risk (PAR)?
d. Population attributable risk fraction (PAR%)?
e.
- i. Relative risk (RR)?
- ii. Odds ratio (OR)?
Answer
2x2 Contingency Table:
| Salt Intake | Hypertension (+) | Hypertension (−) | Total |
|---|---|---|---|
| High Salt (Exposed) | 34 | 380 | 414 |
| Normal Salt (Unexposed) | 28 | 524 | 552 |
| Total | 62 | 904 | 966 |
- Incidence in exposed (
): - Incidence in unexposed (
): - Incidence in total population (
):
- a. Attributable Risk (Risk Difference,
):
- b. Attributable Risk Fraction (
):
- c. Population Attributable Risk (
):
- d. Population Attributable Risk Fraction (
):
- e.
- i. Relative Risk (
):
- ii. Odds Ratio (
):
- i. Relative Risk (
THG37-016
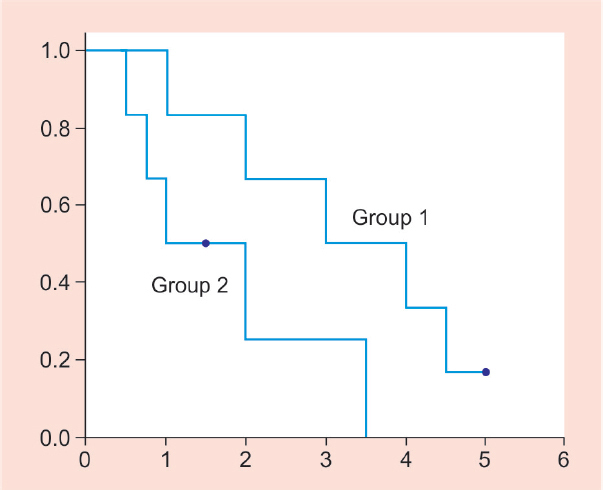
a. What does above image show?
b. What does the step like drop represent?
c. What does the length of the vertical line represent?
d. What does the vertical line mean?
e. What do the “dots” over the lines indicated by arrows denote?
Answer
- a. Kaplan–Meier Survival Curves
- b. Occurrence of the event of interest (e.g., mortality, treatment failure, relapse).
- c. Magnitude of decrease in cumulative survival probability at that specific time point.
- d. Instantaneous drop in survival probability at the time of an event.
- e. Censored observations (patients lost to follow-up, withdrew, or completed the study period without experiencing the event).
THG37-017
In a study, it was found that mean [standard deviation (SD)] blood sugar of 250 children was 94.0 (3.0).
a. What is the standard error (SE) of mean?
b. What is the 95% confidence interval?
Answer

- a. Standard Error of the Mean (
):
- b. 95% Confidence Interval (
):
THG37-018
For a study to find out the prevalence of attention deficit hyperactivity disorder (ADHD) among <16 years old children in Chennai, with a predicted prevalence of 4.1% ADHD from previous Delhi study, for a 95% confidence level and for ±1% of actual prevalence (degree of precision).
a. What is the sample size estimated?
Answer
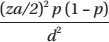
- a. Sample size calculation for prevalence:
(for 95% confidence level) (predicted prevalence = 4.1%) (absolute precision = )
THG37-019
It was planned to study the effectiveness of oral iron therapy in anemic children (Hb <10 g/dL) aged 1–5 years. One group was exposed to oral iron with diet and the other group with placebo and diet. A similar study reported improvement of 95% among iron group and 75% among placebo group. For an expected 95% confidence limits and precision of 5%.
a. What is the sample size required in each group?
Answer
![[images/image_rsrc1ZU2.jpg]]
- a. Sample size for comparing two independent proportions:
, , (precision = 5%)
(Orper group depending on formula precision notation).
THG37-020
In a study to assess the role of head nodding in predicting hypoxia, 112 children were assessed. Among 57 children who had hypoxia, 29 had head nodding. Two out of 55 who did not have hypoxia presented with head nodding.
What is the:
a. Sensitivity
b. Specificity
c. Positive predictive value
d. Negative predictive value
e.
- i. Likelihood ratio for positive test?
- ii. Likelihood ratio for negative test of head nodding in predicting hypoxia?
Answer
2x2 Contingency Table:
| Head Nodding | Hypoxia Present (+) | Hypoxia Absent (−) | Total |
|---|---|---|---|
| Present (+) | 29 (TP) | 2 (FP) | 31 |
| Absent (−) | 28 (FN) | 53 (TN) | 81 |
| Total | 57 | 55 | 112 |
- a. Sensitivity:
- b. Specificity:
- c. Positive Predictive Value (PPV):
- d. Negative Predictive Value (NPV):
- e.
- i. Positive Likelihood Ratio (
):
- ii. Negative Likelihood Ratio (
):
- i. Positive Likelihood Ratio (
THG37-021
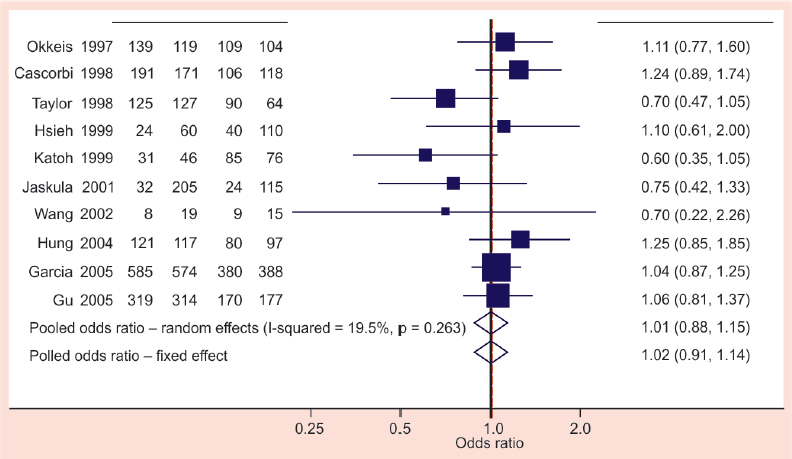
a. What does below image show?
b. What do the names and numbers in the first column represent?
c. What do the numbers in the rest of the columns on left hand side represent?
d. What do the numbers on the right hand represent?
e. What does the vertical line represent?
Answer
- a. Forest Plot (Blobbogram) in a meta-analysis.
- b. Names of individual primary studies (author/year) included in the systematic review.
- c. Sample sizes, event counts, or continuous variable means/SDs for intervention and control groups.
- d. Quantitative effect sizes (Odds Ratio / Relative Risk / Mean Difference) with their 95% Confidence Intervals and statistical study weights (%).
- e. Line of Null Effect (
/ / ).
THG37-022
Identify correct responses with reference to significance for the odds ratio and 95% confidence intervals mentioned:
| OR (95% CI) | Significance |
|---|---|
| 1. 9 (0.6–12.0) | Significant / Not significant |
| 2. 9 (0.5–12.0) | Significant / Not significant |
| 3. 9 (0.8–10.0) | Significant / Not significant |
| 4. 9 (5.0–12.0) | Significant / Not significant |
Answer
-
- 9 (0.6–12.0): Not significant (95% CI includes 1.0)
-
- 9 (0.5–12.0): Not significant (95% CI includes 1.0)
-
- 9 (0.8–10.0): Not significant (95% CI includes 1.0)
-
- 9 (5.0–12.0): Statistically Significant (95% CI does not include 1.0; entirely above 1.0)
THG37-023
Match the terms with appropriate explanations:
| Term | Explanation |
|---|---|
| 1. Population | a. Measures obtained for entire target population |
| 2. Parameter | b. Fraction of the population that is selected |
| 3. Variability in sources | c. Target group of investigation |
| 4. Sample | d. Measures obtained for sample population |
| 5. Statistic | e. Uncertainties in medical care |
Answer
- 1: c (Target group of investigation)
- 2: a (Measures obtained for entire target population)
- 3: e (Uncertainties in medical care)
- 4: b (Fraction of the population that is selected)
- 5: d (Measures obtained for sample population)
THG37-024
Match the terms with appropriate explanations:
| Term | Explanation |
|---|---|
| 1. Null hypothesis ( |
a. A specific direction is predicted |
| 2. Two-tailed hypothesis | b. There is a relationship / difference |
| 3. Alternate hypothesis ( |
c. No relationship / no difference |
| 4. One-tailed hypothesis | d. Specific statement of prediction |
| 5. Hypothesis | e. No direction is predicted |
Answer
- 1: c (No relationship / difference exists)
- 2: e (No specific direction is predicted)
- 3: b (There is a relationship / difference)
- 4: a (A specific direction is predicted)
- 5: d (Specific testable statement of prediction)
THG37-025
Match the appropriate “tests of significance” for the scenario mentioned:
| Scenario | Statistical Test Preferred |
|---|---|
| 1. Comparison of two independent group means (Gaussian) | a. Wilcoxon rank-sum (Mann–Whitney U test) |
| 2. Comparison of two independent group means (Non-Gaussian) | b. Student’s t-test (Unpaired) |
| 3. Comparison of means in |
c. Student’s t-test (Paired) |
| 4. Comparison of paired mean values (Gaussian) | d. Wilcoxon signed-rank test |
| 5. Comparison of paired values (Non-Gaussian) | e. Analysis of Variance (ANOVA) |
Answer
- 1: b (Student's t-test - Unpaired)
- 2: a (Wilcoxon rank-sum / Mann–Whitney U test)
- 3: e (Analysis of Variance - ANOVA)
- 4: c (Student's t-test - Paired)
- 5: d (Wilcoxon signed-rank test)
THG37-026
Match the statements in the columns with reference to the “levels of evidence” appropriately:
| Level of Evidence | Description |
|---|---|
| 1. Level I | a. Strong evidence from at least one properly designed RCT of appropriate size |
| 2. Level II | b. Evidence from well-designed nonexperimental studies from |
| 3. Level III | c. Strong evidence from at least one systematic review of multiple well-designed RCTs |
| 4. Level IV | d. Opinions of respected authorities, descriptive epidemiology, clinical consensus |
| 5. Level V | e. Evidence from well-designed cohort, case-control, or nonrandomized trials |
Answer
- 1 (Level I): c (Systematic review of multiple well-designed RCTs)
- 2 (Level II): a (At least one properly designed large RCT)
- 3 (Level III): e (Well-designed trials: cohort, case-control, nonrandomized trials)
- 4 (Level IV): b (Well-designed nonexperimental/observational studies from >1 center)
- 5 (Level V): d (Opinions of expert authorities, clinical reports, committee consensus)
THG37-027
Mention against each statement regarding the “Institutional Ethics Committee (IEC)” whether it is True or False:
| Statement | True/False |
|---|---|
| 1. IEC is dependent on other committees and the needs of the institution | |
| 2. All research involving human subjects (or their records) must be reviewed by an Institutional Review Board (IRB) | |
| 3. IEC cannot take up the responsibility of review of both the scientific content and ethical aspects of the proposal | |
| 4. One institution cannot have more than one IRB | |
| 5. Small institutions could form alliance with other IECs or approach registered IEC |
Answer
-
- False (IEC must function independently of institutional administration and financial influence).
-
- True (All human subject research requires prior ethical clearance).
-
- False (IEC can and should evaluate both scientific validity and ethical rigor).
-
- False (Large institutions can have multiple specialized IRBs, e.g., biomedical, socio-behavioral).
-
- True (Small institutions without their own IEC can utilize accredited external or institutional ethics committees).