MNJ08-001
In relation to growth charts:
- Will the standards be applicable to all children?
- What reference data should be used for children older than 5 years?
- How will these new standards change current estimates of overweight (for 8 years old) and undernutrition (infancy) in children?
- Which countries were involved in the WHO MGRS study?
- What is mid-parental height and target centiles?
Answer
- Yes, they can be applied to all children everywhere, regardless of ethnicity, socioeconomic status, and type of feeding (growth in early childhood is primarily driven by nutrition, environment, and healthcare).
- WHO Reference 2007 for boys and girls (5–19 years).
- Wasting/undernutrition rates in infancy will be substantially higher using the new WHO standards. With respect to overweight, use of the new WHO standards will result in a greater prevalence of overweight/obesity detection.
- Six countries representing diverse geographic regions: Brazil, Ghana, India, Norway, Oman, and the United States.
- Mid-Parental Height (MPH):
- Boys:
- Girls:
- Target range:
(or plotted at 18 years).
- Boys:
MNJ08-002
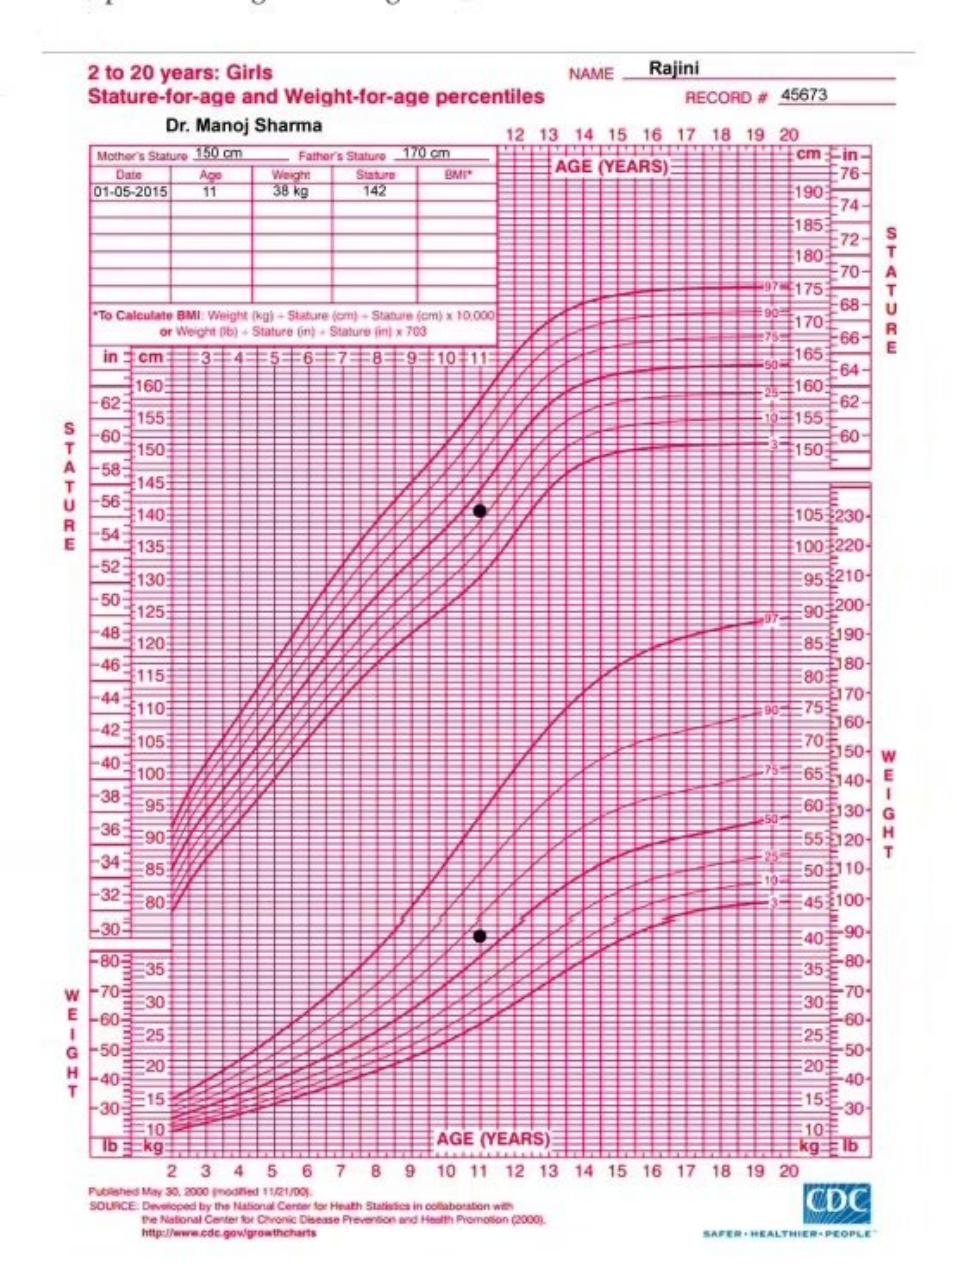
A 10-year-old girl Rajini has weight 38 kg and height 142 cm. Her mother is 150 cm and father is 170 cm. Record this data and calculate:
- Mid-Parental Height (MPH)
- Target range
- Height age
- Weight age
- Ideal height (50th centile for age)
- Is she stunted?
- Is she wasted?
Answer
- MPH:
(or calculated for boys/girls respectively; raw text note states: ). - Target range:
to (approx ). - Height age: 10.5 years (age at which 142 cm is the 50th centile).
- Weight age: 11 years (age at which 38 kg is the 50th centile).
- Ideal height: ~138–140 cm (50th percentile for a 10-year-old girl).
- Stunted: No (Height is between 50th and 75th centiles).
- Wasted: No (Weight is appropriate/slightly above for height).
MNJ08-003
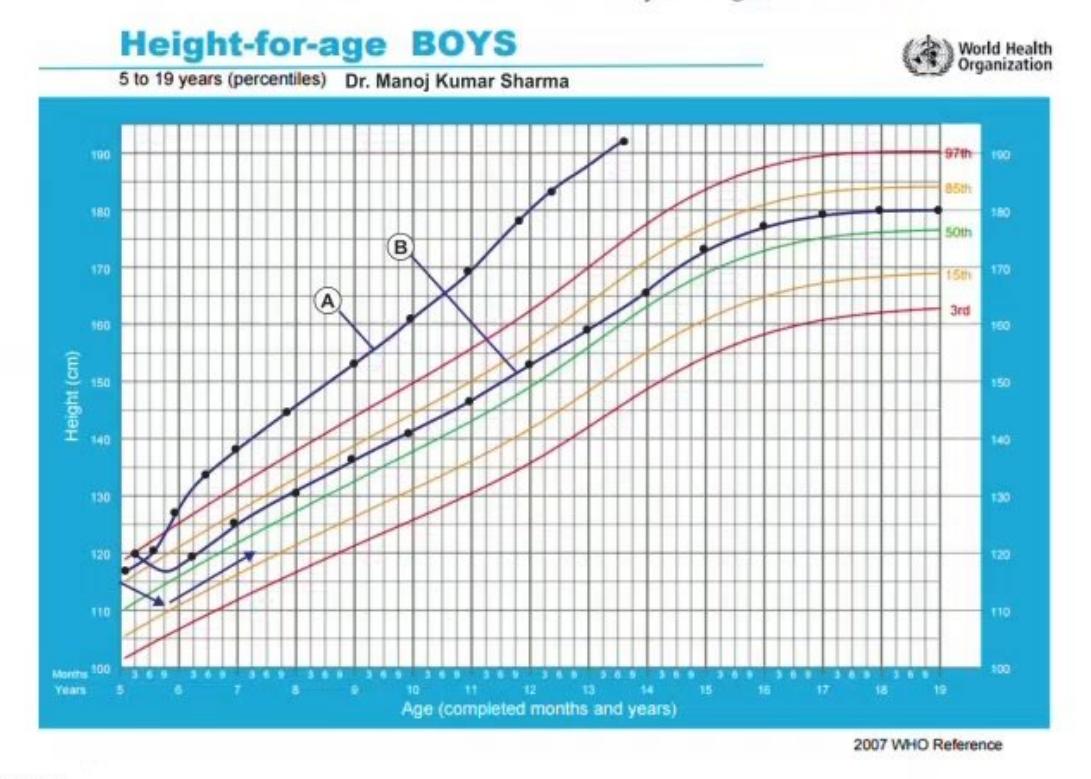
An 11-year-old female Aditi was brought with a history of fever for 2 days caused by "viral pharyngitis". Her doctor, after routine measurement of height and weight, asked her to undergo certain tests:
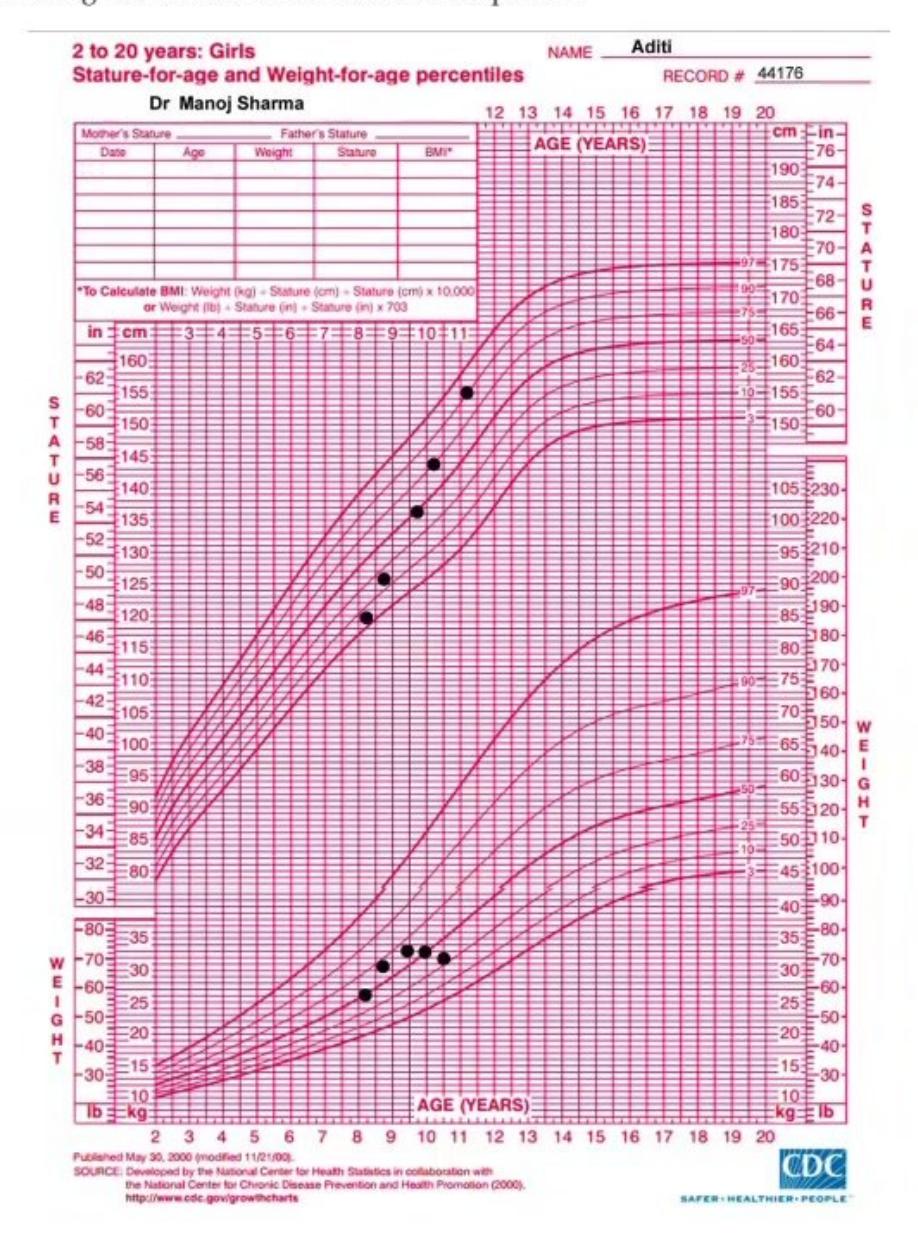
- Interpret the chart.
- Likely diagnosis. Is this pubertal growth spurt?
- Why is this not familial?
- What investigations will confirm the clinical suspicion?
Answer
- Interpretation: Increasing height centiles (crossing two percentile lines upwards, accelerated growth velocity) accompanied by decreasing weight centiles (weight loss).
- Likely diagnosis: Hyperthyroidism (Thyrotoxicosis). It is not a normal pubertal spurt because there is significant concomitant weight loss.
- Not familial: In familial tall/short stature, the growth velocity is normal and follows a constant centile channel; here the growth velocity is abnormally accelerated crossing percentiles.
- Investigations: Free T3, Free T4, and Serum TSH.
MNJ08-004
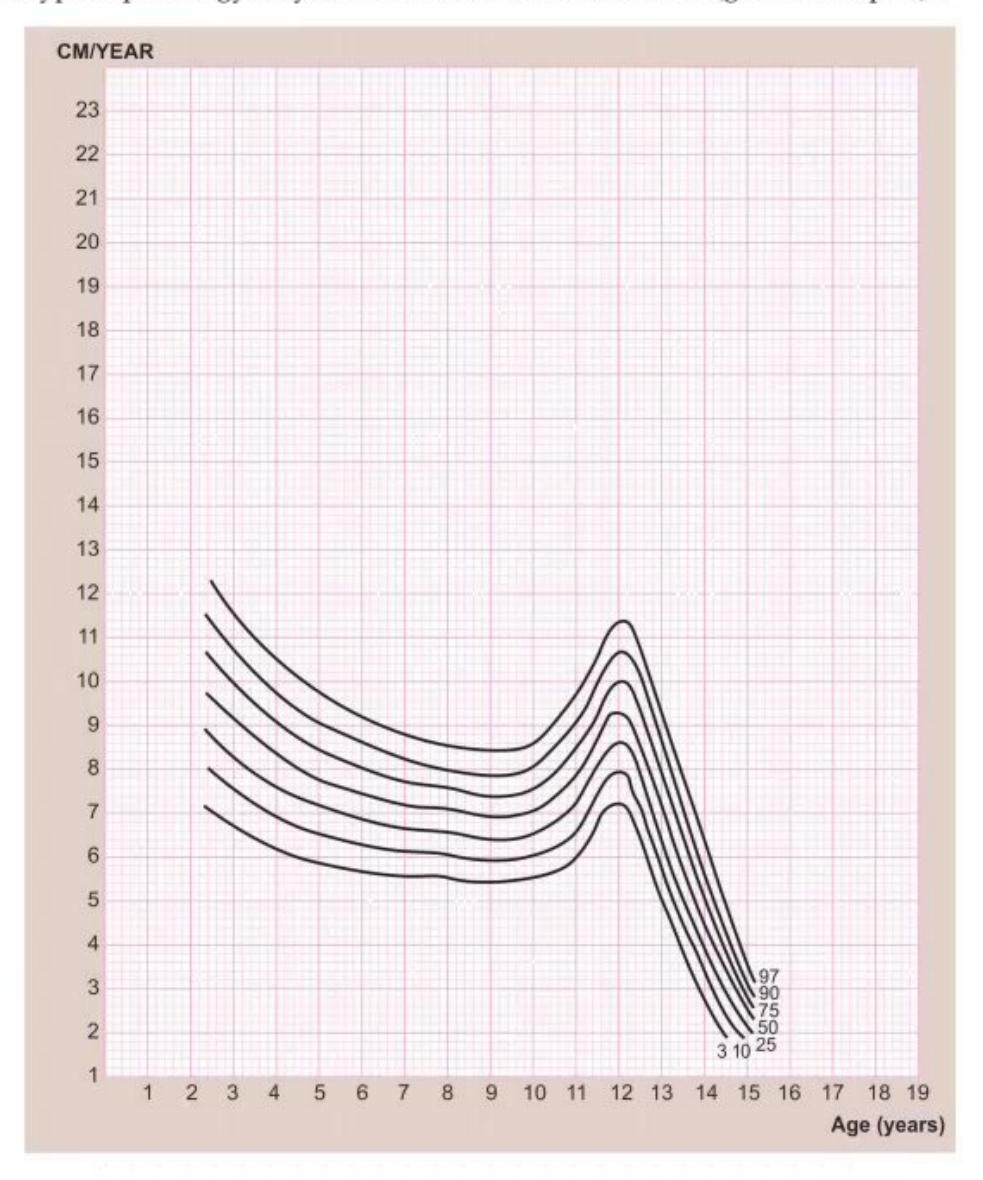
- What does this chart show?
- How do you interpret the red lines?
- Give the normal values for this parameter at different age groups.
- What type of pathology do you think this child suffered from (give 2 examples)?
Answer
- Chart: Height velocity (growth velocity) chart.
- Interpretation: Sudden sharp acceleration in growth velocity above the 97th centile at age 7–8 years, followed by rapid deceleration.
- Normal Growth Velocity by Age:
| Age Period | Gain in Height |
|---|---|
| 0–12 months | 25 cm/year |
| 1–2 years (2nd year) | 12 cm/year |
| 2–3 years (3rd year) | 8 cm/year |
| 3–4 years (4th year) | 7 cm/year |
| 4 years to onset of puberty | 5–6 cm/year |
| Pubertal spurt | 8–10 cm/year (girls), 10–12 cm/year (boys) |
- Pathology: Endocrine/accelerated growth conditions, e.g., Precocious Puberty, Hyperthyroidism, Growth-hormone secreting tumor.
MNJ08-005
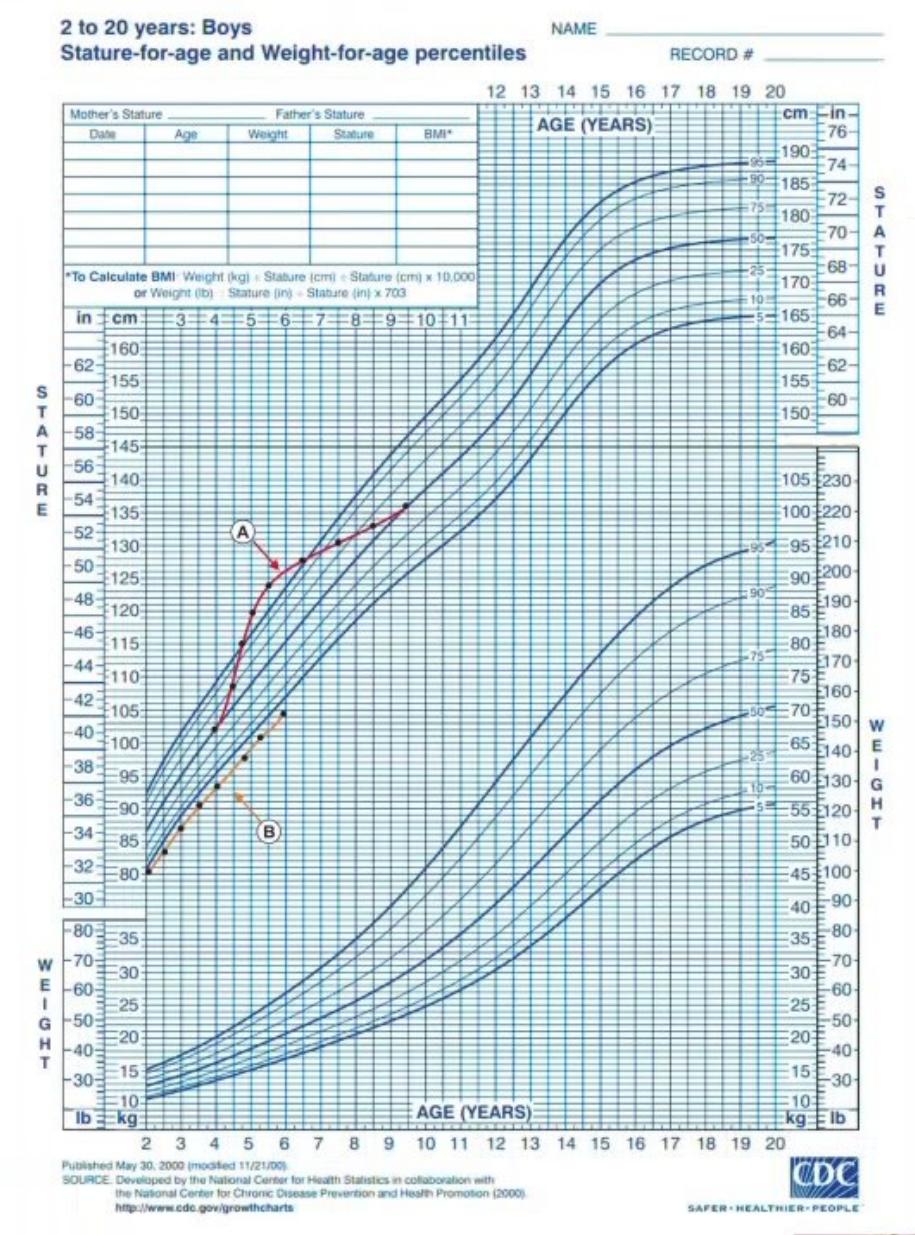
- In patient A (female, now age 11 years), what is your diagnosis? How do you interpret her growth chart?
- Patient B was born with weight 2.3 kg and length 47 cm. His mother is 152 cm and father is 160 cm. Both do not have skeletal dysplasia. What is your diagnosis? Give 3 points on which you base your diagnosis.
Answer
- Patient A:
- Diagnosis: Precocious puberty (or hyperthyroidism) successfully treated.
- Interpretation: Normal growth velocity till 5 years, followed by sudden acceleration in growth velocity between 6–8 years (crossing percentiles upwards), which normalized back parallel to centiles after treatment.
- Patient B:
- Diagnosis: Familial Short Stature (Genetic Short Stature).
- Basis of diagnosis:
- Short parents (target height is low/matches child's centile).
- Normal growth velocity parallel to and just below the 3rd centile.
- Chronological age = Bone age > Height age (
).
MNJ08-006
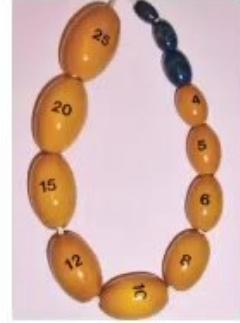
- Name this device and mention its use.
- What do the individual numbers signify?
- What do you use if this device is not available during examination of a child with early puberty, and how do you interpret the results?
Answer
- Device: Prader Orchidometer. Used to assess testicular volume for pubertal staging.
- Individual numbers: Testicular volume in milliliters (
), ranging from to . - Prepubertal:
- Pubertal onset (Tanner Stage 2):
- Adult:
- Prepubertal:
- Alternative: Simple ruler to measure testicular long-axis length:
: Prepubertal (Tanner Stage 1) : Pubertal onset (Stage 2) : Stage 3 : Stage 4 : Stage 5 (Adult)
MNJ08-007
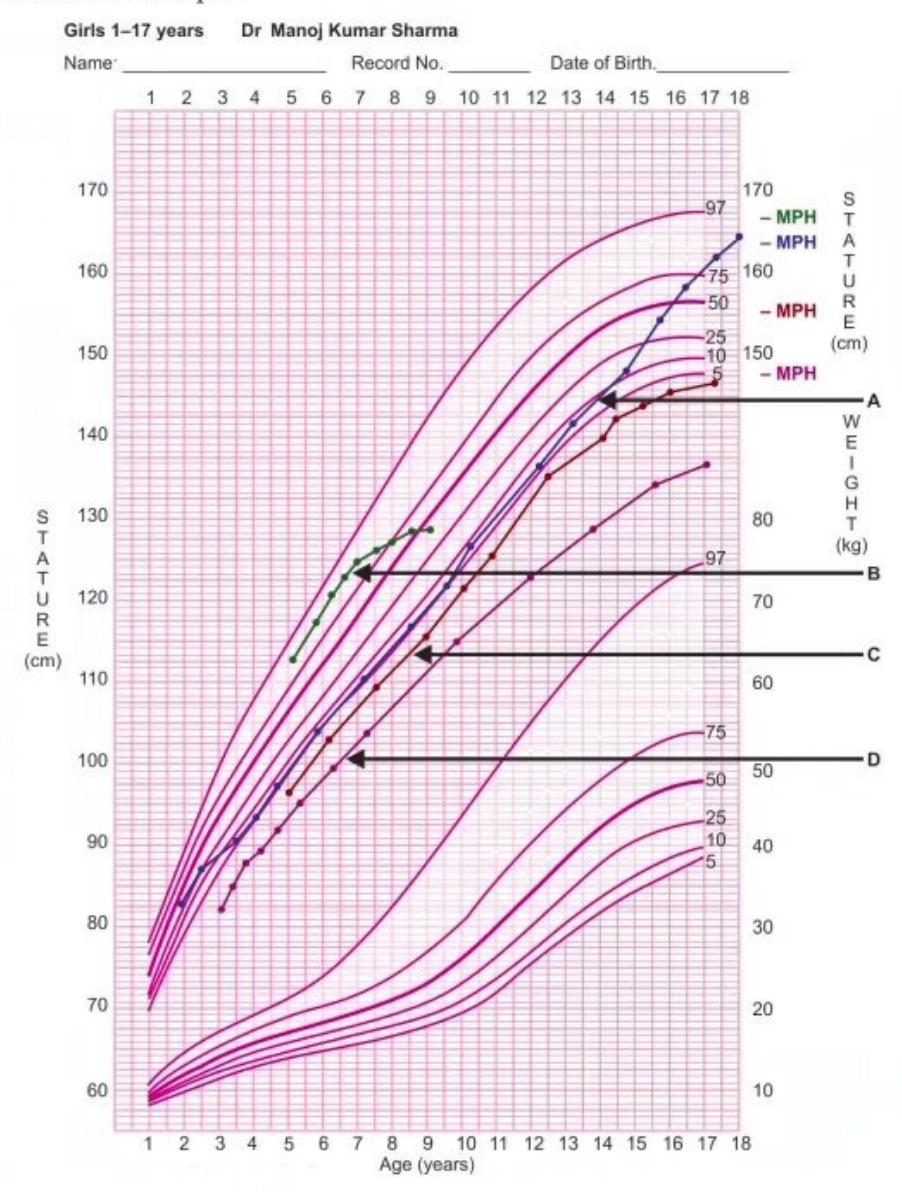
Agarwal growth chart for girls depicting typical growth patterns in familial short stature, constitutional delay of growth and puberty, Turner syndrome, and hypothyroidism:

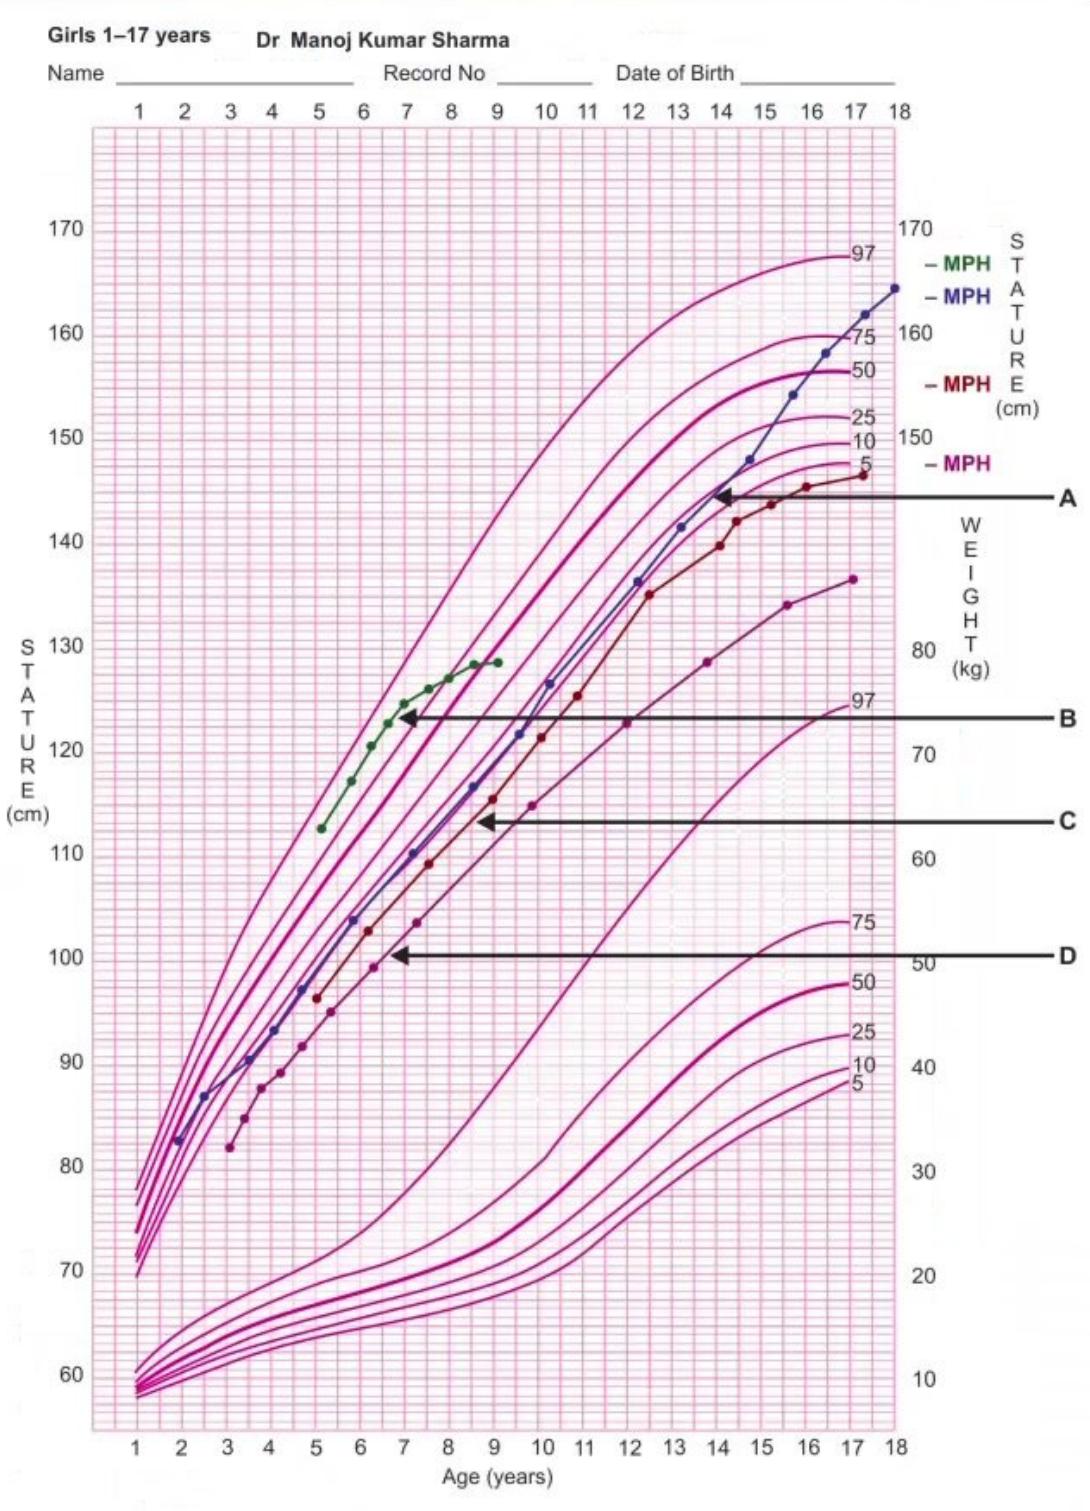
Match the curves A, B, C, and D with the following conditions:
- Constitutional delay of growth and puberty
- Familial short stature
- Hypothyroidism
- Turner syndrome
Answer
- A
3: Hypothyroidism (severe deceleration of growth velocity crossing percentiles downwards) - B
1: Constitutional delay of growth and puberty (growth parallel below 3rd centile with delayed pubertal spurt achieving normal adult height) - C
4: Turner syndrome (progressive loss of height centiles during childhood and absent pubertal growth spurt) - D
2: Familial short stature (growth parallel to 3rd centile, normal timing of puberty, adult height within target range)
Match: A-3, B-1, C-4, D-2.
MNJ08-008
(May 2013):
A. Match the following in a child with short stature:
| Clinical / Radiologic Findings | Diagnosis |
|---|---|
| 1. |
A. Familial Short Stature |
| 2. |
B. Celiac Disease / Systemic illness |
| 3. |
C. Constitutional Delay of Growth |
B. Match the following in a child with tall stature:
| Clinical / Radiologic Findings | Diagnosis |
|---|---|
| 1. |
A. Exogenous Obesity |
| 2. |
B. Precocious Puberty |
Answer
A. Short Stature:
- 1 – C:
with normal GV Constitutional Delay of Growth and Puberty - 2 – A:
with normal GV Familial Short Stature - 3 – B:
with abnormal GV Pathological / Systemic (e.g., Celiac disease, Hypothyroidism, PEM)
B. Tall Stature:
- 1 – A:
with normal GV Simple / Exogenous Obesity - 2 – B:
with abnormal GV Precocious Puberty
MNJ08-009
- Identify the chart.
- What phenomenon is sought to be reflected in the sequential plot of values in this chart?
- What does the arrow indicate? What is the clinical significance of this?
- What is the difference between child A and child B?
- How will child A and child B be classified at 16 years of age in terms of their BMI?
Answer
- CDC 2000 BMI-for-age percentile growth chart (2 to 20 years).
- Tracking of BMI from early childhood into adolescence.
- Adiposity rebound: The normal nadir (lowest point) and subsequent rise in BMI occurring around 5–6 years of age. An early adiposity rebound (e.g., before 5 years) is strongly associated with an increased risk of adolescent and adult obesity.
- Difference: Child A shows early adiposity rebound (around 3–4 years of age) with BMI rising across percentiles, whereas Child B shows normal timing of adiposity rebound (around 6 years of age).
- Classification at 16 years:
- Child A: Obese / Overweight (
). - Child B: Normal weight (
).
- Child A: Obese / Overweight (
MNJ08-010
Study the growth patterns of Child A and Child B:


- Interpret the findings in respect of Child A and Child B.
- What condition can lead to the pattern seen in Child A?
- What is the commonest cause of the pattern seen in Child A? Enlist 1 more condition which can result in a similar picture.
- What is the basis of the pattern seen in Child B?
- What will the weight-for-height plot show for Child A?
Answer
- Interpretation:
- Child A: Decelerated linear growth (falling height centiles) with overweight/increasing weight centiles.
- Child B: Accelerated linear growth (tall stature) accompanying increasing overweight.
- Condition in Child A: Corticosteroid excess / Endocrine obesity (e.g., Cushing syndrome, Hypothyroidism).
- Causes for Child A:
- Commonest: Iatrogenic / Exogenous corticosteroid therapy.
- Other: Endogenous Cushing syndrome (Cushing disease, adrenal adenoma) or primary hypothyroidism.
- Basis in Child B: Simple / Exogenous (nutritional) obesity (which typically stimulates linear growth and advance in bone age).
- Weight-for-height plot in Child A: Markedly increased weight-to-height ratio (
).
MNJ08-011
Growth assessment station:
This male child was born on 09 July 2000.
- Enumerate the steps to assess the height and weight parameters of the child.
- The father's height is 168 cm and the mother's height is 158 cm. What is the child's expected adult height?
- Does the child require evaluation for short stature or obesity? Enumerate the steps of calculation and criteria.
Answer
-
Steps in physical growth assessment:
- Introduce self and make child comfortable.
- Calculate exact decimal chronological age from birth date.
- Obtain accurate weight (minimum clothing/underwear) and standing height using a calibrated stadiometer (Frankfurt horizontal plane).
- Select appropriate growth chart (e.g., IAP 2015 / WHO charts).
- Plot height-for-age, weight-for-age, and BMI-for-age.
- Interpret percentiles for wasting, stunting, or overweight.
-
Mid-Parental / Expected Adult Height:
- Target Range:
( ).
-
Evaluation Criteria:
- Short Stature Evaluation: Indicated if height-for-age is
(or ) OR if projected adult height is below target height range. - Obesity Evaluation:
- Plot on BMI-for-age chart:
: Normal weight. : Overweight / Risk of obesity. : Obesity (requires detailed evaluation).
- Short Stature Evaluation: Indicated if height-for-age is
MNJ08-012
- Identify EACH of the 4 growth patterns shown (1 to 4).
- Write the relationship between Chronological Age (CA), Bone Age (BA), Height Age (HA), and Growth Velocity (GV) with respect to each pattern.
Answer
-
Pattern 1: Constitutional Delay of Growth and Puberty (CDGP)
- Growth Velocity: Normal
-
Pattern 2: Acquired Growth Failure / Systemic Illness (e.g., Hypothyroidism, Celiac Disease, PEM)
- Growth Velocity: Subnormal / Decreased (abnormal)
-
Pattern 3: Familial Short Stature (Genetic Short Stature)
- Growth Velocity: Normal
-
Pattern 4: Endocrine Short Stature / Chromosomal (e.g., Turner Syndrome, Growth Hormone Deficiency)
(or delayed BA) - Growth Velocity: Subnormal / Decreased (abnormal)
MNJ08-013

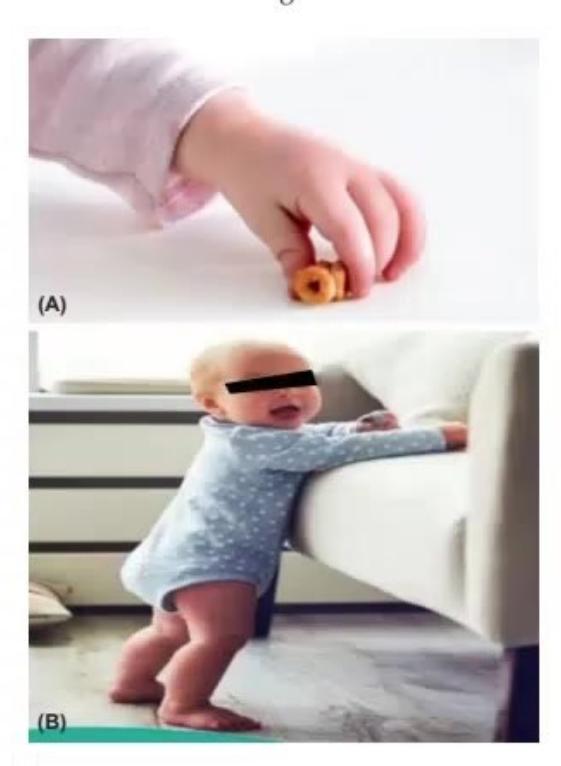
- What is the infant performing in image A?
- What is his possible developmental age?
- What is an important social milestone at this age?
Answer
- Inferior/mature pincer grasp (picking up a small object/pellet with thumb and index finger).
- 9–12 months (mature neat pincer grasp at 10–12 months; crude pincer at 9 months).
- Stranger anxiety / Waves "bye-bye" / Plays peek-a-boo.