VVK13-001
Answer the following:
- a. Define median, 1st quartile and 3rd quartile.
- b. What is the difference between rate and ratio?
- c. What is the basic difference between a 'case control' and 'cohort' study design?
- d. What is the difference between incidence and prevalence?
Answer
- a. If observations are arranged in ascending or descending order:
- Median: 50% of observations are below and 50% are above this value.
- 1st Quartile (
): 25% of observations are below and 75% are above this value. - 3rd Quartile (
): 75% of observations are below and 25% are above this value.
- b. Rate: Numerator is a part of the denominator and has a time dimension. Ratio: Numerator is not part of the denominator (comparison of two separate quantities).
- c. Case-control study: Retrospective (starts with disease and looks back for exposure/antecedent). Cohort study: Prospective (starts with exposure and follows forward to observe outcome/disease).
- d. Incidence: Number of new cases occurring in a defined population during a specified period of time. Prevalence: Total number of all cases (old and new) existing at a given point in time (point prevalence) or over a period (period prevalence).
VVK13-002
Interpret the following statement:
In a RCT, the 'odds' of developing HMD were 0.55 (95% CI 0.3–2.1) in infants whose mothers were given 'antenatal steroids'.
Answer
In infants of mothers who received antenatal steroids, the odds of developing HMD are 45% less (
VVK13-003
In a small government hospital, 60% of early neonatal deaths have low-birth-weight. It is also seen that nearly 5% births in this hospital die within a week and about 30% births have low-birth-weight. Calculate the probability that a low-birth-weight baby would die in early neonatal period.
Answer
Bayes' Theorem / Conditional Probability:
- Let
, (5%) - Let
, (30%) - Given
(60%)
Probability that a low-birth-weight baby would die in the early neonatal period is 10%.
VVK13-004
The height of 10 children of the same age group is given (all in cm):
101, 98, 98, 99, 102, 101, 100, 98, 101, 101
Calculate:
- a. Mean
- b. Mode
- c. Median
Answer
Arranging in ascending order:
98, 98, 98, 99, 100, 101, 101, 101, 101, 102
- a.
- b.
(appears 4 times) - c.
VVK13-005
At a camp, a new model of mass miniature radiography was used to screen for tuberculosis. Subsequently, the subjects were also subjected to CT scan of the chest to confirm whether the results were reliable or not. The results were as follows:
| Screening test | Diseased | Not diseased |
|---|---|---|
| Positive | a (TP) | b (FP) |
| Negative | c (FN) | d (TN) |
Calculate (give formulae):
- a. Specificity
- b. Sensitivity
- c. Positive predictive value (PPV)
- d. Negative predictive value (NPV)
Answer
- a.
- b.
- c.
- d.
VVK13-006
Out of 50 babies delivered in a hospital, 10 were stillbirths. Out of this, 5 were less than 1000 g. Out of the survivors, 5 died in first month of life.
- a. Calculate:
-
- Stillbirth rate
-
- Neonatal mortality rate
-
- b. Define perinatal mortality rate.
Answer
- a. Calculations:
-
- b. Perinatal Mortality Rate (PMR): Total number of late fetal deaths (
of gestation or fetus ) plus early neonatal deaths (first 7 days of life) per 1000 total births.
VVK13-007
Out of a population of 5000 children in a village, 500 cases of malnutrition already exist. There are 100 newly diagnosed cases in a year. 20 children died of malnutrition.
Calculate:
- a. Prevalence rate.
- b. Incidence rate.
- c. Case fatality rate.
- d. What is advantage of calculating prevalence rate?
Answer
- a.
- b.
- c.
- d. Advantages of Prevalence Rate:
- i. Estimates the overall burden/magnitude of the disease in the community.
- ii. Identifies high-risk target groups.
- iii. Useful for health administrative planning, resource allocation, and hospital bed requirements.
VVK13-008
Answer the following questions:
- a. Define p-value.
- b. In a study of 30 patients of liver cirrhosis, enzyme level was evaluated before and after treatment. What statistical test would you apply in this case?
- c. When do you apply non-parametric test?
Answer
- a. p-value: The probability of obtaining results as extreme as, or more extreme than, the observed results purely by chance, assuming the null hypothesis is true (probability of Type I error).
- b. Paired Student's 't' test (paired comparisons on same subjects before and after).
- c. Non-parametric tests are applied when data does not follow a normal (Gaussian) distribution (skewed data), sample size is small, or data is on nominal/ordinal scales.
VVK13-009
Case-Control Study Design:
| Exposure (risk factor) | Disease present | Disease absent | Total |
|---|---|---|---|
| Yes | a | b | a + b |
| No | c | d | c + d |
| Total | a + c | b + d |
- a. Calculate the odds ratio in the given case control study design.
- b. What is the significance of the term odds ratio in statistical terms?
Answer
- a. Odds Ratio (OR):
- b. Significance:
- Odds ratio measures the strength of association between exposure and disease in retrospective case-control studies.
: Exposure does not affect odds of outcome (no association). : Exposure associated with higher odds of outcome (risk factor). : Exposure associated with lower odds of outcome (protective factor).
VVK13-010
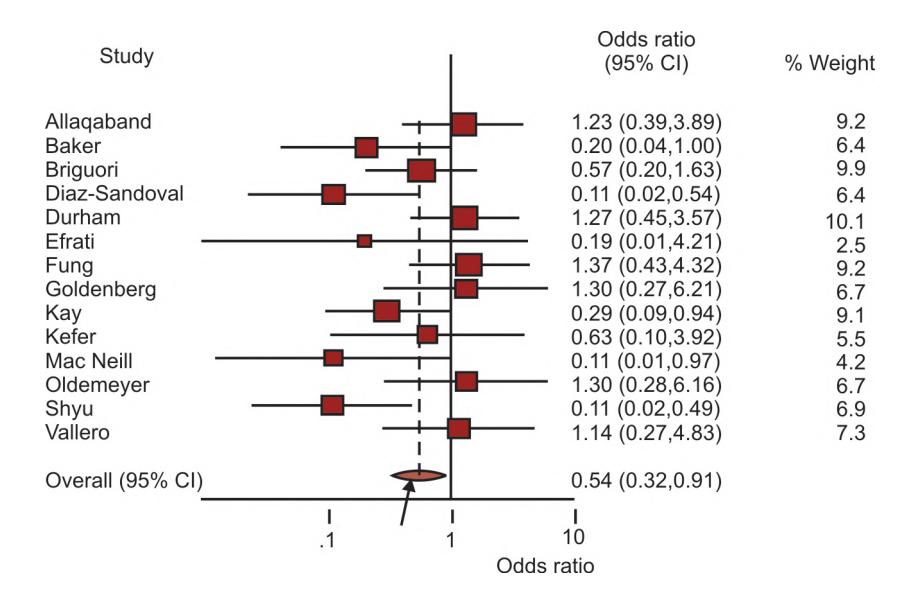
- a. What is this plot known as? And where are they primarily used?
- b. What is the arrowed figure known as?
- c. In this plot which study has the best association regarding the outcome?
Answer
- a. Forest Plot (Blobbogram); primarily used in Meta-analyses and Systematic Reviews to display pooled effect estimates from multiple studies.
- b. Diamond (represents the pooled overall summary effect estimate with its 95% confidence interval).
- c. Study done by Kay (has the largest effect size and narrowest confidence interval).
VVK13-011
You are doing a study "Is zinc better than racecadotril for diarrhea" and the results are:
| Group | Improvement | No Improvement (Nil) | Total |
|---|---|---|---|
| Zinc | 12 | 27 | 39 |
| Racecadotril | 6 | 20 | 26 |
- a. Calculate the relative risk (RR).
- b. What does it signify?
Answer
- a. Relative Risk (RR):
- b. Improvement with zinc therapy is
times more likely compared to racecadotril therapy.
VVK13-012
Answer the following:
- a. In an area the under-5 mortality is 5/1000 live births. Calculate the child survival index in that area.
- b. What is the appropriate statistical test to compare two means?
- c. What is the appropriate statistical test to compare two proportions?
Answer
- a. Child Survival Index:
- b. Student's unpaired 't' test (for two independent continuous means).
- c. Chi-Square (
) test or Fisher's exact test (for two categorical proportions).
VVK13-013
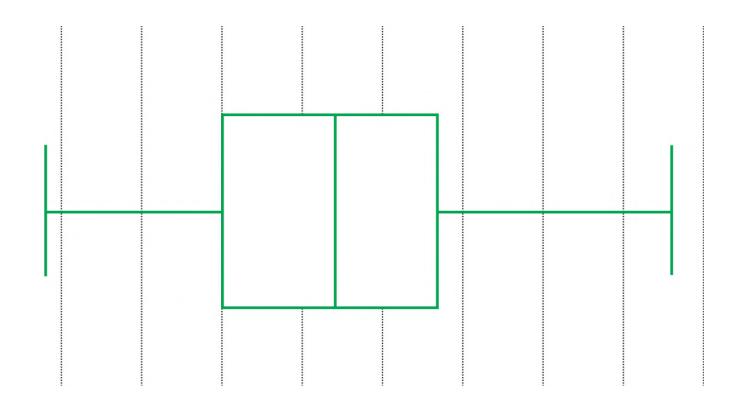
- a. What is this plot known as?
- b. What is this used for?
- c. Describe the plot.
Answer
- a. Box-and-Whisker Plot (Boxplot).
- b. Displays a 5-number summary of continuous variables: Minimum, 1st Quartile (25th percentile), Median (50th percentile), 3rd Quartile (75th percentile), Maximum, and Outliers.
- c. Components:
- The central rectangular box spans the Interquartile Range (IQR, 25th to 75th percentile).
- The horizontal band inside the box represents the Median.
- Whiskers extend to the minimum and maximum values within
. - Outliers / extreme points are plotted individually beyond the whiskers.
VVK13-014
In an international clinical trial, two chemotherapy treatments are being compared (Choose the correct answer for each of the following questions):
- a. How are systematic differences between treatment groups best minimized?
- i. Analyze results by country separately
- ii. Multivariate analysis
- iii. Patient stratification
- iv. Prognostic factor analysis
- v. Randomization
- b. What is the rationale for conducting a clinical trial in a double blind manner?
- i. It effectively increases the size of the trial by using each patient as their own control.
- ii. It increases comparability of patient characteristics in the treatment and control groups.
- iii. It increases the precision of the estimated effect.
- iv. It reduces systematic bias between the treatment and the control groups.
- v. It reduces the effects of sampling variations.
- c. In a normal distribution the mean of the data will be similar to the:
- i. Maximum
- ii. Median
- iii. Range
- iv. Standard deviation
- v. Standard error
- d. The table below shows the number of adverse effects reported in a randomized trial comparing two treatments — A and B:
| Treatment group | Adverse Events: Yes | Adverse Events: No | Total |
|---|---|---|---|
| A | 4 | 28 | 32 |
| B | 16 | 12 | 28 |
| Total | 20 | 40 | 60 |
The odds of having an adverse event in group A is:
- i. 4/16
- ii. 4/20
- iii. 4/28
- iv. 4/32
- v. 4/60
Answer
- a. v. Randomization (balances both known and unknown confounding variables).
- b. iv. It reduces systematic bias between the treatment and control groups (prevents observer and subject bias).
- c. ii. Median (In a normal distribution, Mean = Median = Mode).
- d. iii. 4/28 (
).
VVK13-015
Calculate sensitivity, specificity, positive and negative predictive value of ECG test for myocardial infarction (MI) from the data given below:
| ECG | MI: Present | MI: Absent | Total |
|---|---|---|---|
| Positive | 300 | 100 | 400 |
| Negative | 25 | 75 | 100 |
| Total | 325 | 175 | 500 |
Answer
- Sensitivity
- Specificity
- Positive Predictive Value (PPV)
- Negative Predictive Value (NPV)
VVK13-016
Consider the following retrospective data on the parity of mothers of 210 normal and 140 IUGR babies:
| IUGR | Parity < 3 | Parity |
Total |
|---|---|---|---|
| Present | 98 | 112 | 210 |
| Absent | 92 | 48 | 140 |
- a. What are the odds for mothers with parity < 3 giving birth to IUGR baby as compared to mother with parity
3? - b. What is the difference between odds ratio and relative risk?
Answer
- a. Odds Ratio:
- b. Difference:
- Relative Risk (RR): Ratio of probability of disease in exposed vs unexposed group (
); used exclusively in prospective/cohort studies. - Odds Ratio (OR): Ratio of odds of exposure in cases vs controls (
); used primarily in retrospective case-control studies (estimates RR when disease prevalence is low).
- Relative Risk (RR): Ratio of probability of disease in exposed vs unexposed group (
VVK13-017
Which of the following statements are true regarding power of a study?
- a. Power is the probability of rightly rejecting a null hypothesis when it is false.
- b. Power is directly related to the magnitude of the difference to be detected.
- c. Power increases as the sample size increases.
- d. An increase in the level of significance is a negative feature whereas an increase in power is a positive feature of a statistical test. These should be balanced.
- e. Power increases if a higher probability of type I error can be tolerated.
Answer
All the given statements are correct (True).
VVK13-018
State True / False regarding case control study design:
- a. A case control study is done to generate a hypothesis.
- b. A case control study requires a large number of subjects and large number of controls.
- c. A case control study cannot be retrospective.
- d. A case control study is an analytical study.
- e. A case control study is an observational study.
Answer
- a. False (It tests already formulated hypotheses; descriptive studies generate hypotheses).
- b. False (It can be conducted on relatively small sample sizes compared to cohort studies).
- c. False (It is inherently retrospective).
- d. True (It analyzes the association between exposure and disease with a comparison control group).
- e. True (The investigator observes exposure status without administering an experimental intervention).
VVK13-019
Match the items with appropriate scale of measurement:
| Variable | Scale of Measurement |
|---|---|
| a. Number of cigarettes smoked | i. Ordinal |
| b. Body temperature | ii. Ratio |
| c. Age in completed years | iii. Interval |
| d. Age in categories (child, adolescent, adult) | iv. Metric |
| e. Stage of a cancer | v. Continuous variable |
| f. Blood sugar levels | vi. Discrete variable |
Answer
- a. Number of cigarettes smoked
ii. Ratio (or Discrete variable) - b. Body temperature
iii. Interval - c. Age in completed years
iv. Metric (or Ratio) - d. Age in categories (child, adolescent, adult)
i. Ordinal - e. Stage of a cancer
i. Ordinal / vi. Discrete variable - f. Blood sugar levels
v. Continuous variable
VVK13-020
Answer the following:
- a. You use a histological test for cancer that has sensitivity, specificity, positive predictivity and negative predictivity in excess of 90%. Which of the four indicators would you use to reassure a patient that the positive test could still be an error?
- b. Which test would you use for ruling out a disease in a patient?
- c. Which test would you use for confirming a disease in a patient?
Answer
- a. Positive Predictive Value (PPV): If PPV is 90%, it means there is still a 10% chance that the person with a positive test does not have the disease (False positive rate among test positives is
). - b. Test with high Sensitivity (SnNOut: High Sensitivity test when Negative rules OUT disease) / High NPV.
- c. Test with high Specificity (SpPIn: High Specificity test when Positive rules IN disease) / High PPV.
VVK13-021
Consider the following data:
- Total population of children in an area: 1300
- Protected against measles by vaccination: 800
- Total cases of measles in one year: 10
- Primary cases: 2
- Number of susceptible children coming in contact with primary cases: 15
- Secondary cases that received infection from primary cases within infective period: 8
Calculate:
- a. Attack rate of measles.
- b. Secondary attack rate of measles.
Answer
-
a. Attack Rate:
-
b. Secondary Attack Rate (SAR):
VVK13-022
In hospital data, fetal deaths during late gestation (> 28 weeks) was found to be 2%. Out of all remaining live births, 3% died within 1 week. What is the perinatal mortality rate in this hospital?
Answer
- Assume 100 total pregnancies reaching
weeks: - Fetal deaths (Stillbirths)
- Live births
- Early neonatal deaths (within 1 week)
- Fetal deaths (Stillbirths)